
Using Pentaho Row Normaliser step

In this article we will learn how to use Pentaho Data Integration Row Normalizer Step. Normalizer step is used to normalize data from pivot or denormalized table. It allows us to change how the relationship between rows is displayed. For each value in each pivot column, Row Normalizer produces a row in the output data set. We can create new field sets to specify more than one pivot columns. It basically convert Columns to Rows.
Let us consider we have source data file as Excel sales budget for different stores based on year & quarters. We may want to transform the sales budget data based on the quarters for each of the stores.
Let's consider we have the following data in excel as yearly & quarterly sales budget:
| STORE | YEAR | QUARTER1 | QUARTER2 | QUARTER3 | QUARTER4 |
| Clementi | 2016 | 50000 | 70000 | 65000 | 85000 |
| River Valley | 2016 | 30000 | 29000 | 33000 | 31000 |
| Clementi | 2017 | 55000 | 75000 | 70000 | 88000 |
So in this scenario we can use the Row Normaliser step to normalize the pivot data and will further load into Oracle database. Let's take a look at the expected normalized dataset below:
| STORE | YEAR | QUARTER | BUDGET |
| Clementi | 2016 | Q1 | 50000 |
| Clementi | 2016 | Q2 | 70000 |
| Clementi | 2016 | Q3 | 65000 |
| Clementi | 2016 | Q4 | 85000 |
| River Valley | 2016 | Q1 | 30000 |
| River Valley | 2016 | Q2 | 29000 |
| River Valley | 2016 | Q3 | 33000 |
| River Valley | 2016 | Q4 | 31000 |
| Clementi | 2017 | Q1 | 55000 |
| Clementi | 2017 | Q2 | 75000 |
| Clementi | 2017 | Q3 | 70000 |
| Clementi | 2017 | Q4 | 88000 |
Below are the steps we will be covering in this use case scenario.
- Read excel data file, using Microsoft Excel Input
- Normalize pivot data, using Row Normalizer
- Write normalized data to Oracle database table, using Table output
Find below the use case transformation:
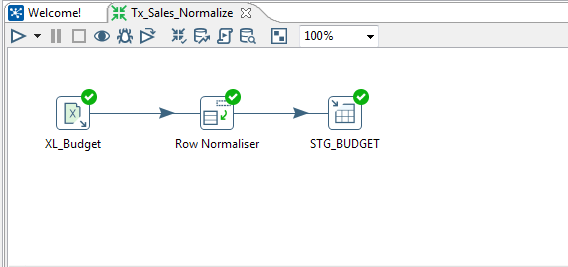
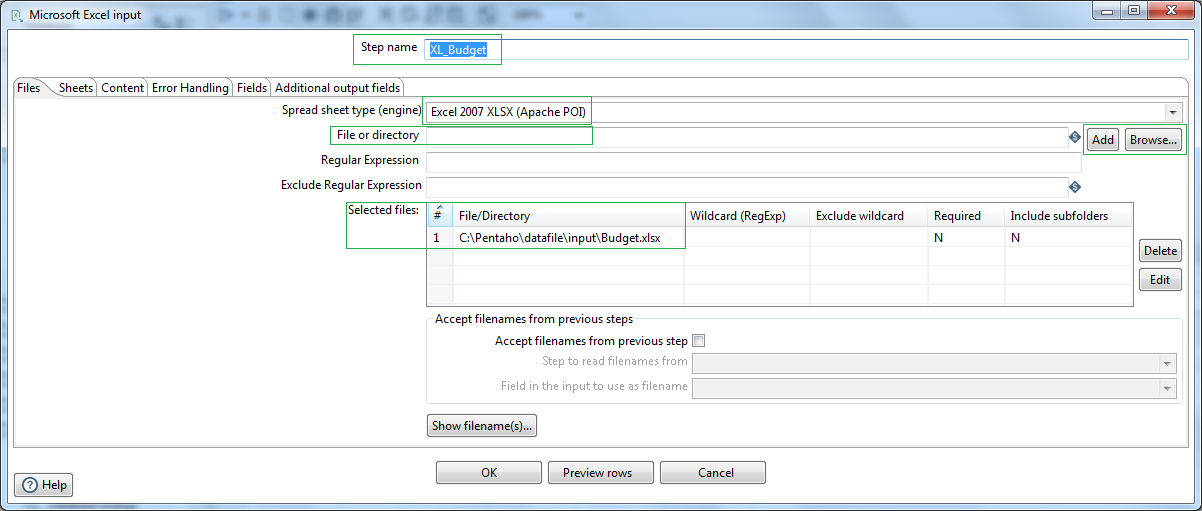
First in order to read excel file we will be using Microsoft excel input. Let's name the step as XL_Budget. Select spread sheet type as Excel 2007 XLSX Apache POI. Browse and locate the input excel file and click the Add button.
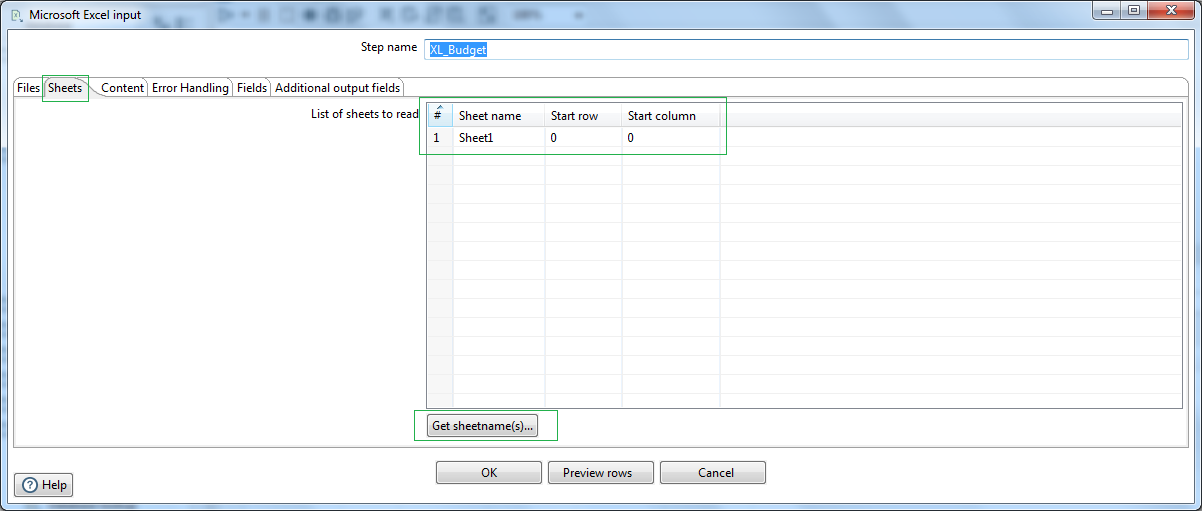
Next go to the Sheets tab and click on Get sheetname(s)... Select the correct data sheet. In my case it is Sheet1. In the contents tab check the Header option, as we have a header record in our excel sheet.
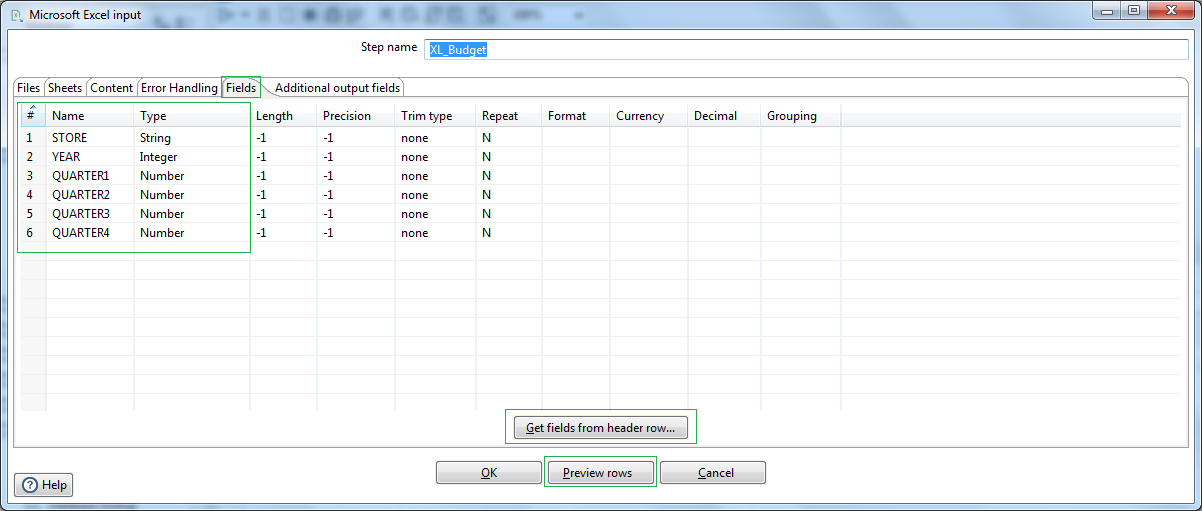
In the Fields tab, click the button Get fields from header row. Check and modify the Fields name & data type. Preview your records to confirm that PDI is able to read the excel file content as expected.
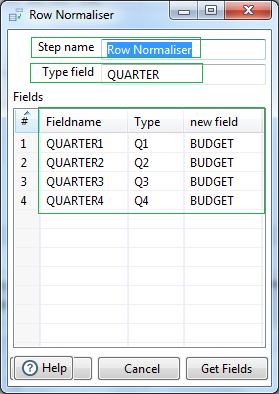
Next we are using a Row Normaliser step. Select the Type field as the QUARTER. This will be Output field name. Next in the Fields section map the Source fields namely Quarter1,2,3 & 4. Let's put the Type as Q1, Q2, Q3 & Q4. So the QUARTER output field will have these types as the output values. Let's name the corresponding new fields as BUDGET. This field will give the amount figures corresponding to the quarter types.
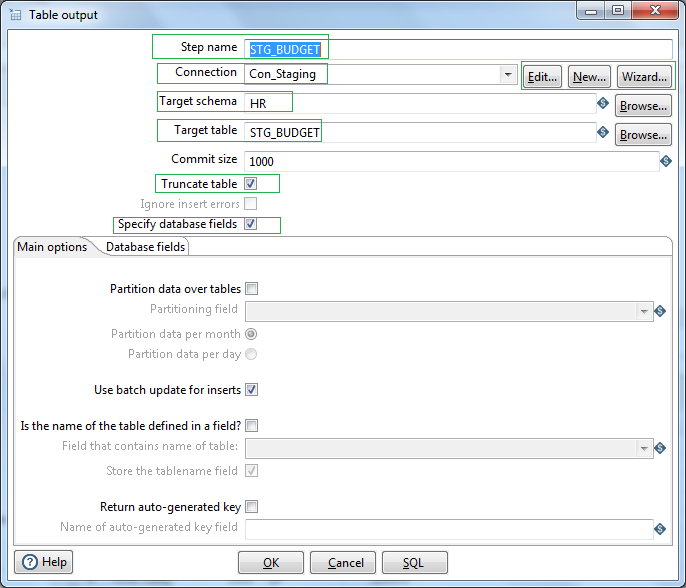
In order to write the normalized data into relational database, in our case Oracle RDBMS, we will use Table output step. Lets name this step as STG_BUDGET. At first we need to create the connection object. Click New or Wizard and create a connection.
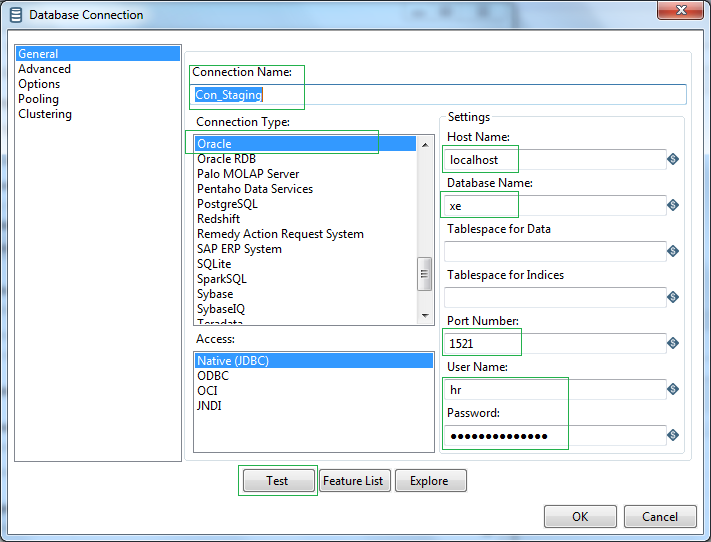
Let's name the connection as Con_Staging. Select Connection type as Oracle & Driver as Native (JDBC). The Oracle jdbc driver might not be available to PDI. In that case you have to download oracle jdbc driver ojdbc6.jar and place in the PDI lib directory, i.e. data-integration/lib/ . Next define the hostname, database name, port, username and password to connect to your oracle instance. Test to check the connection and click OK.
Once the database connection is ready, browse the relevant target schema. Let's keep the target table name as STG_BUDGET. Select Truncate table option.
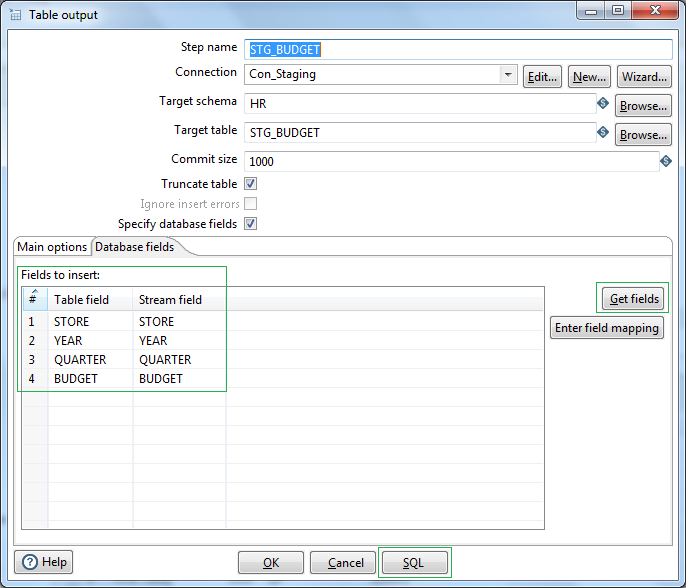
Next select Specify database fields and click on Get fields button under the Database fields tab. This will list the fields available in the prior Step. Next click on SQL. This will show the required DDL to create the table in the Target schema. Once verified okay, click on Execute to create the table directly in database. Note the database user for this connection object should have DDL create grant. That's all. So the target RDBMS table is ready to be loaded.
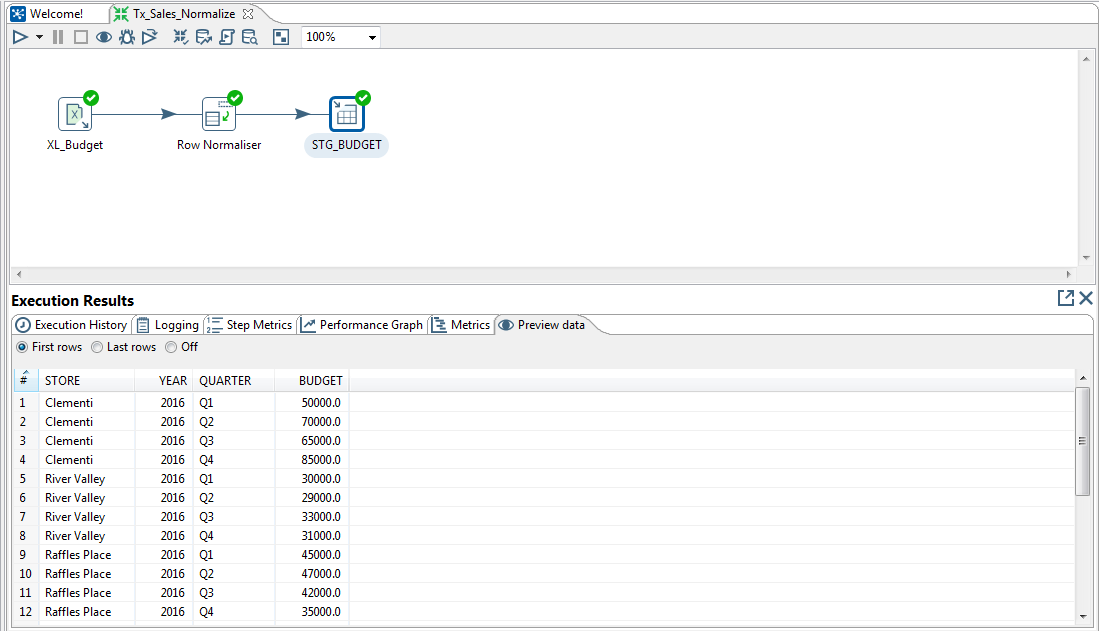
Let us run the Transformation from Spoon and validate the output data in the table from the Preview tab of the Execution Results section.
So we have successfully completed excel read, normalize pivot data and RDBMS write. In the next article we will check the reverse scenario on data denormalization using Denormalizer.