Analyze Athena Datasource using QuickSight

QuickSight is Amazon’s Business Intelligence pay-per-session service which allows you to create and publish interactive dashboards and charts. Quicksight can query data with Athena to provide easy-to-understand insights.
In our previous article we analyzed the S3 data directly using Athena via standard SQL. Let us go further to analyze the Athena Datasource using QuickSight and generate some visualizations.
Let's get started. The very first time you access QuickSight service, you will need to sign-up for a plan. Click on Sign up for QuickSight.

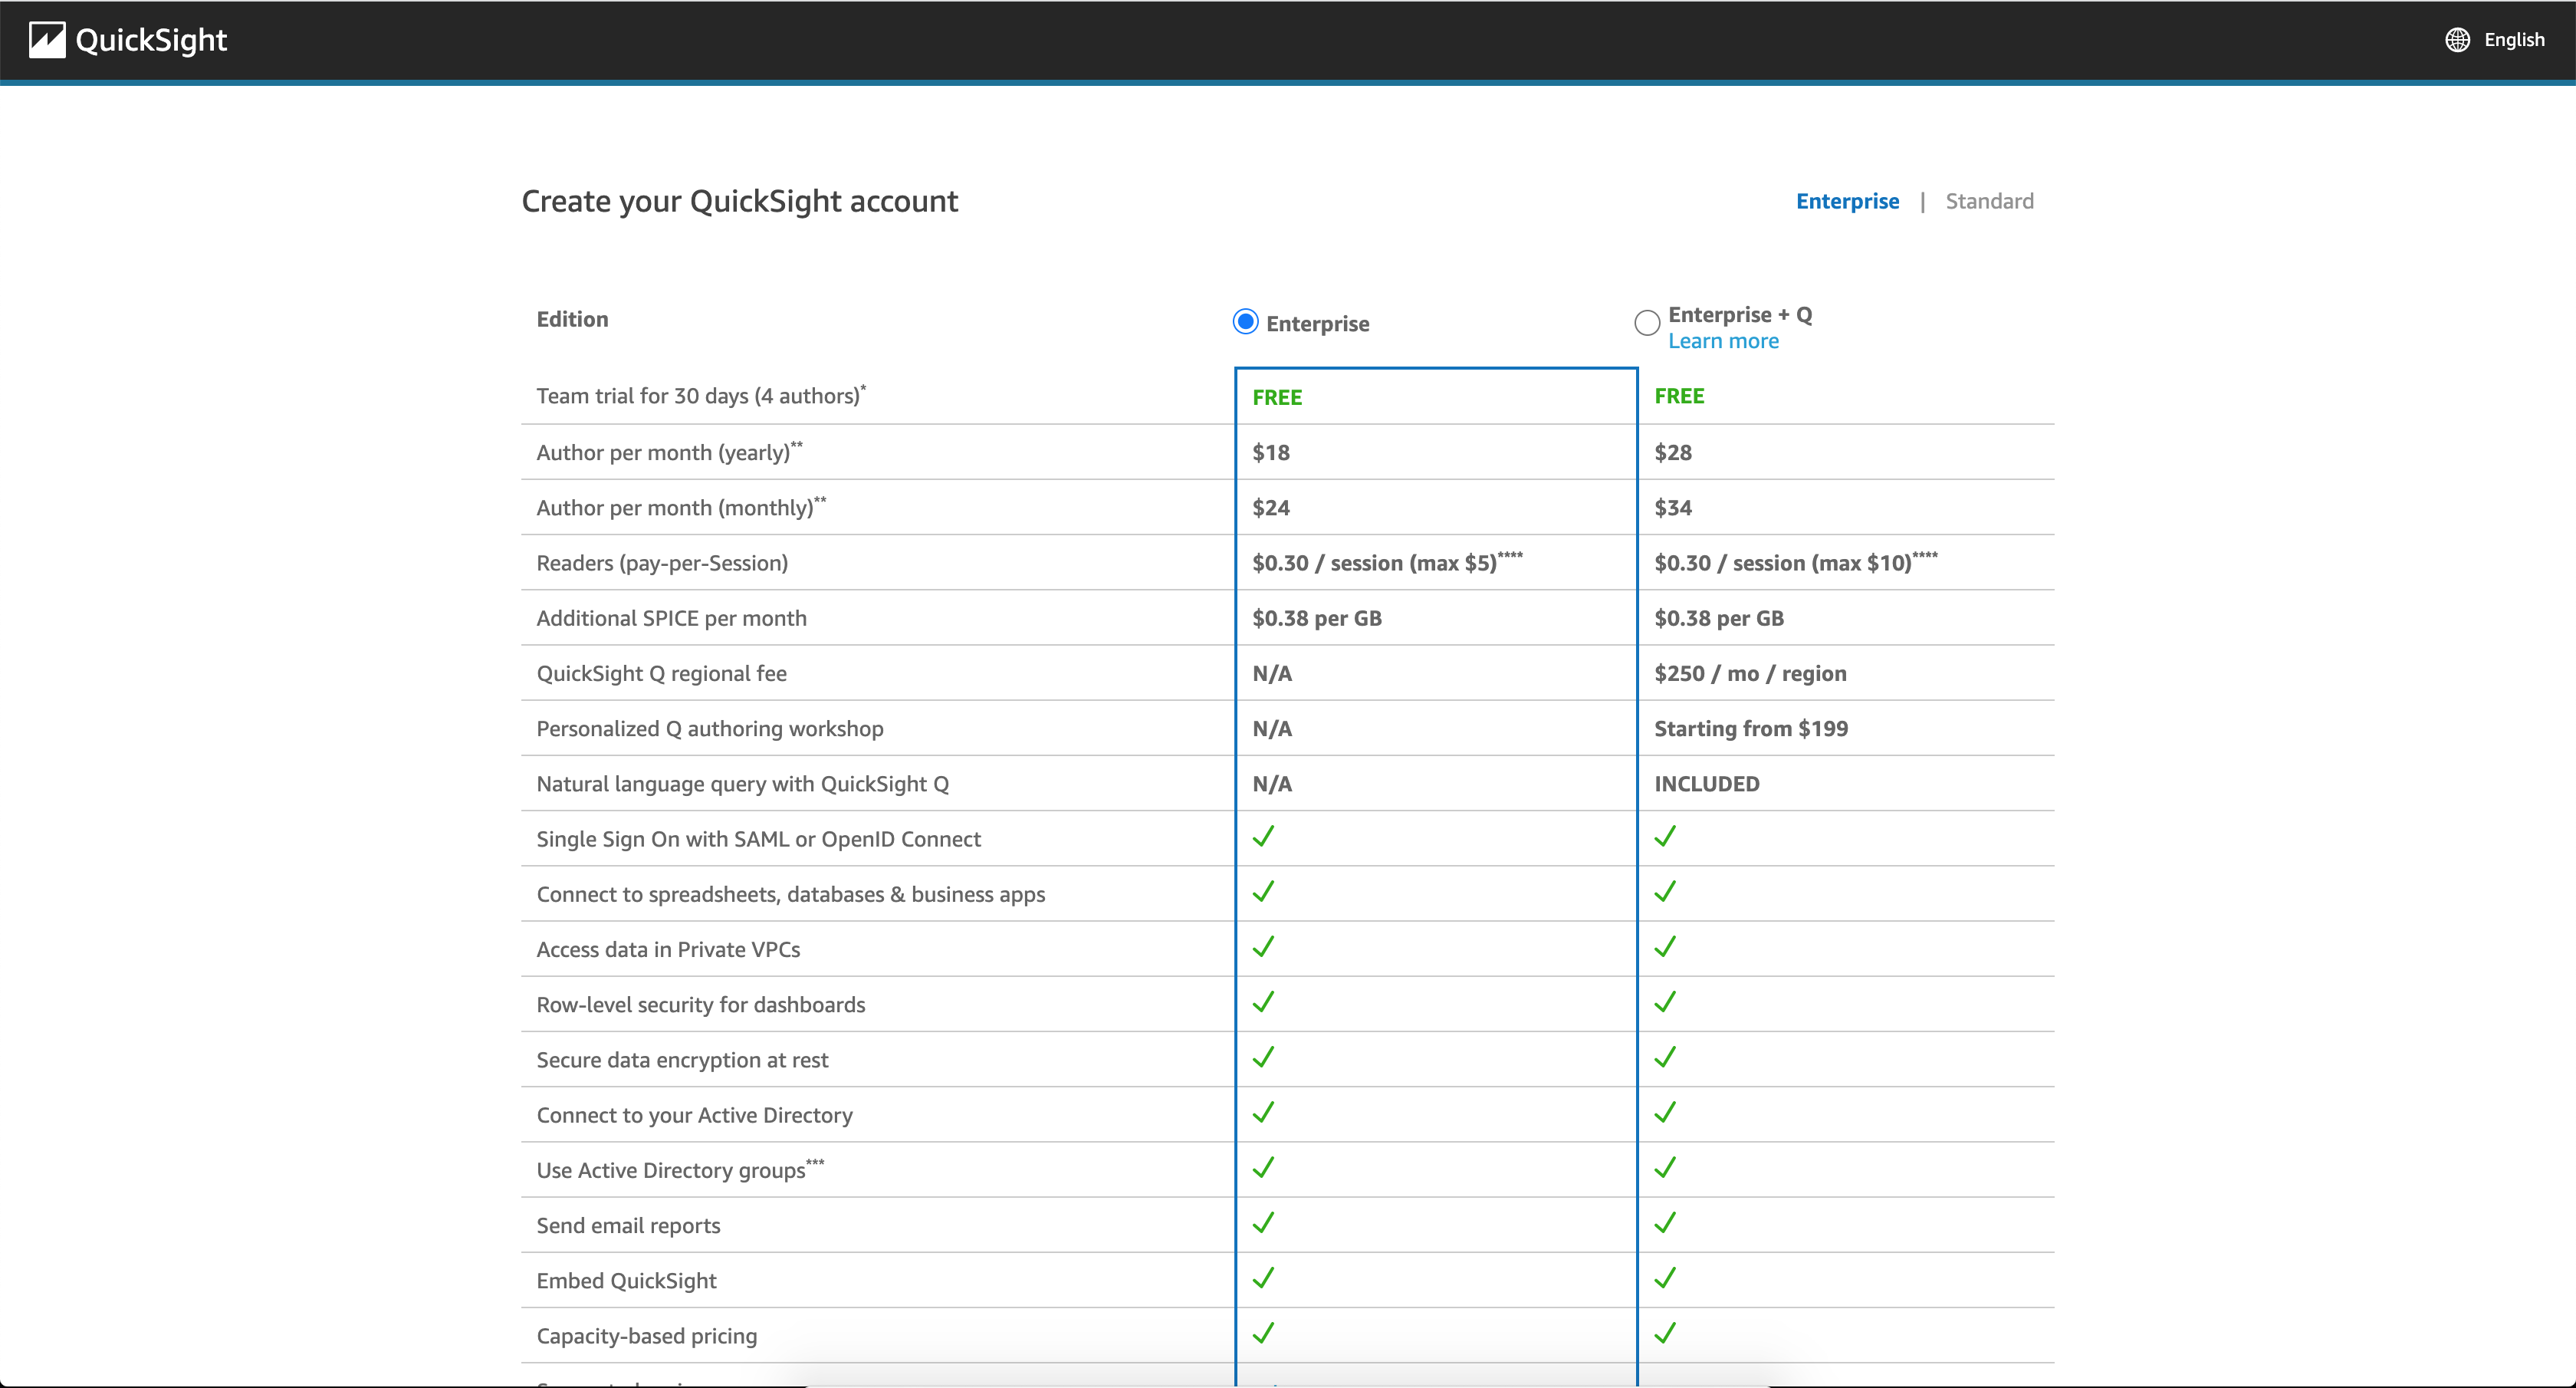
QuickSight offers 3 plans to choose from. Select a relevant QuickSight plan as per your need. Here I have selected the Standard Plan which offers a 30 days trial usage.
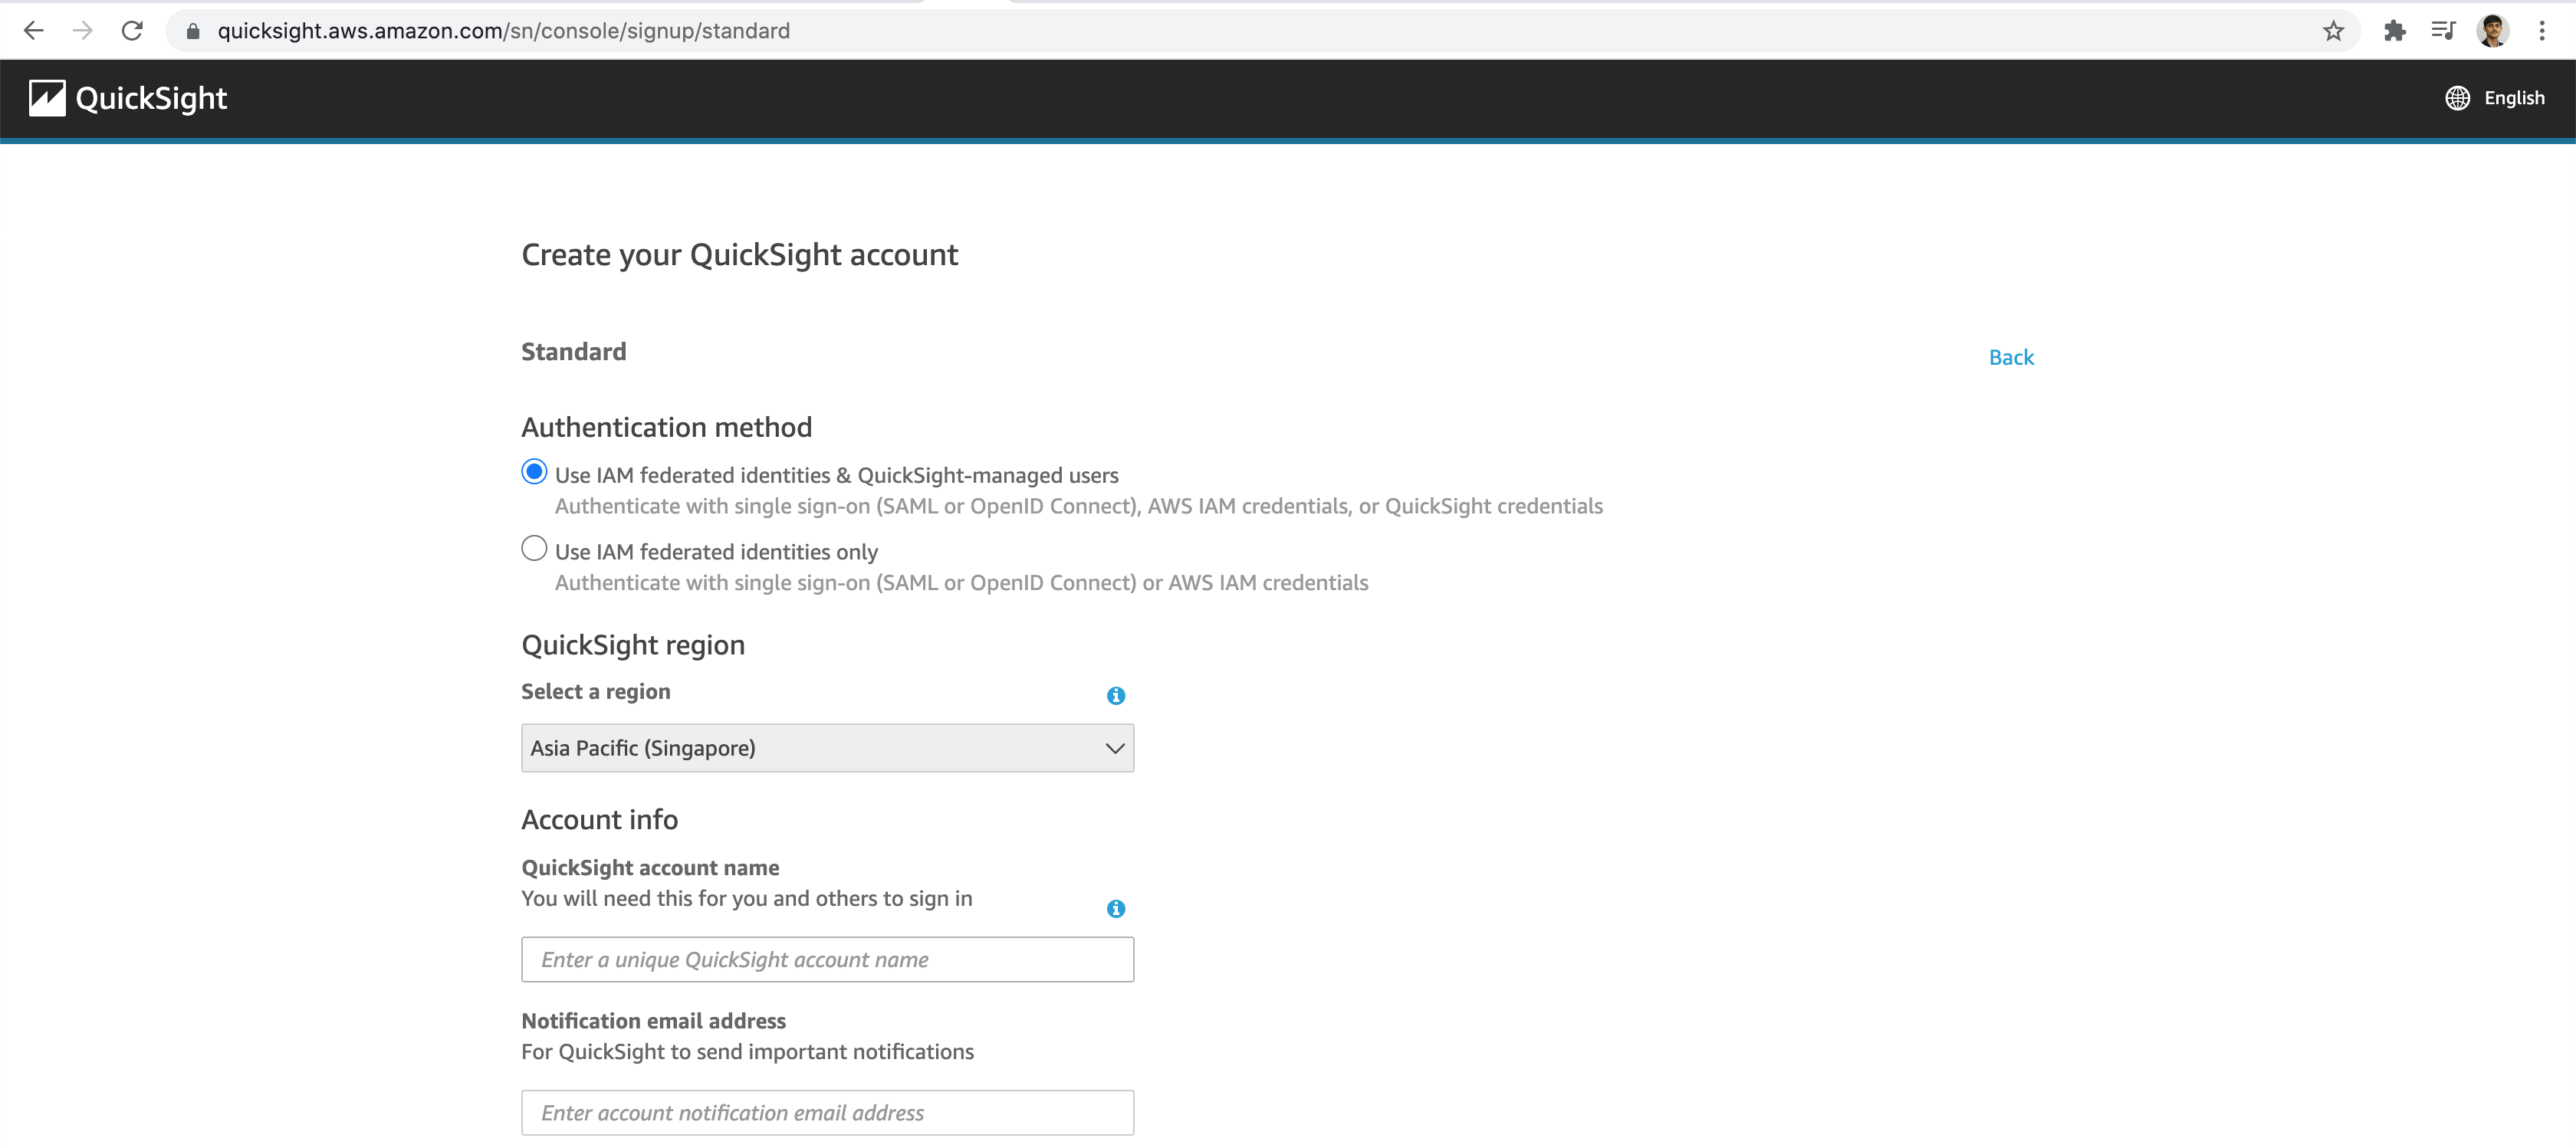
Choose your preferred Authentication method to sign-in to QuickSight. Also select your preferred region.
Enter your QuickSight Account Information accordingly.
- Account Name: MyOrg
- Notification Email Address: admin@myorg.demo
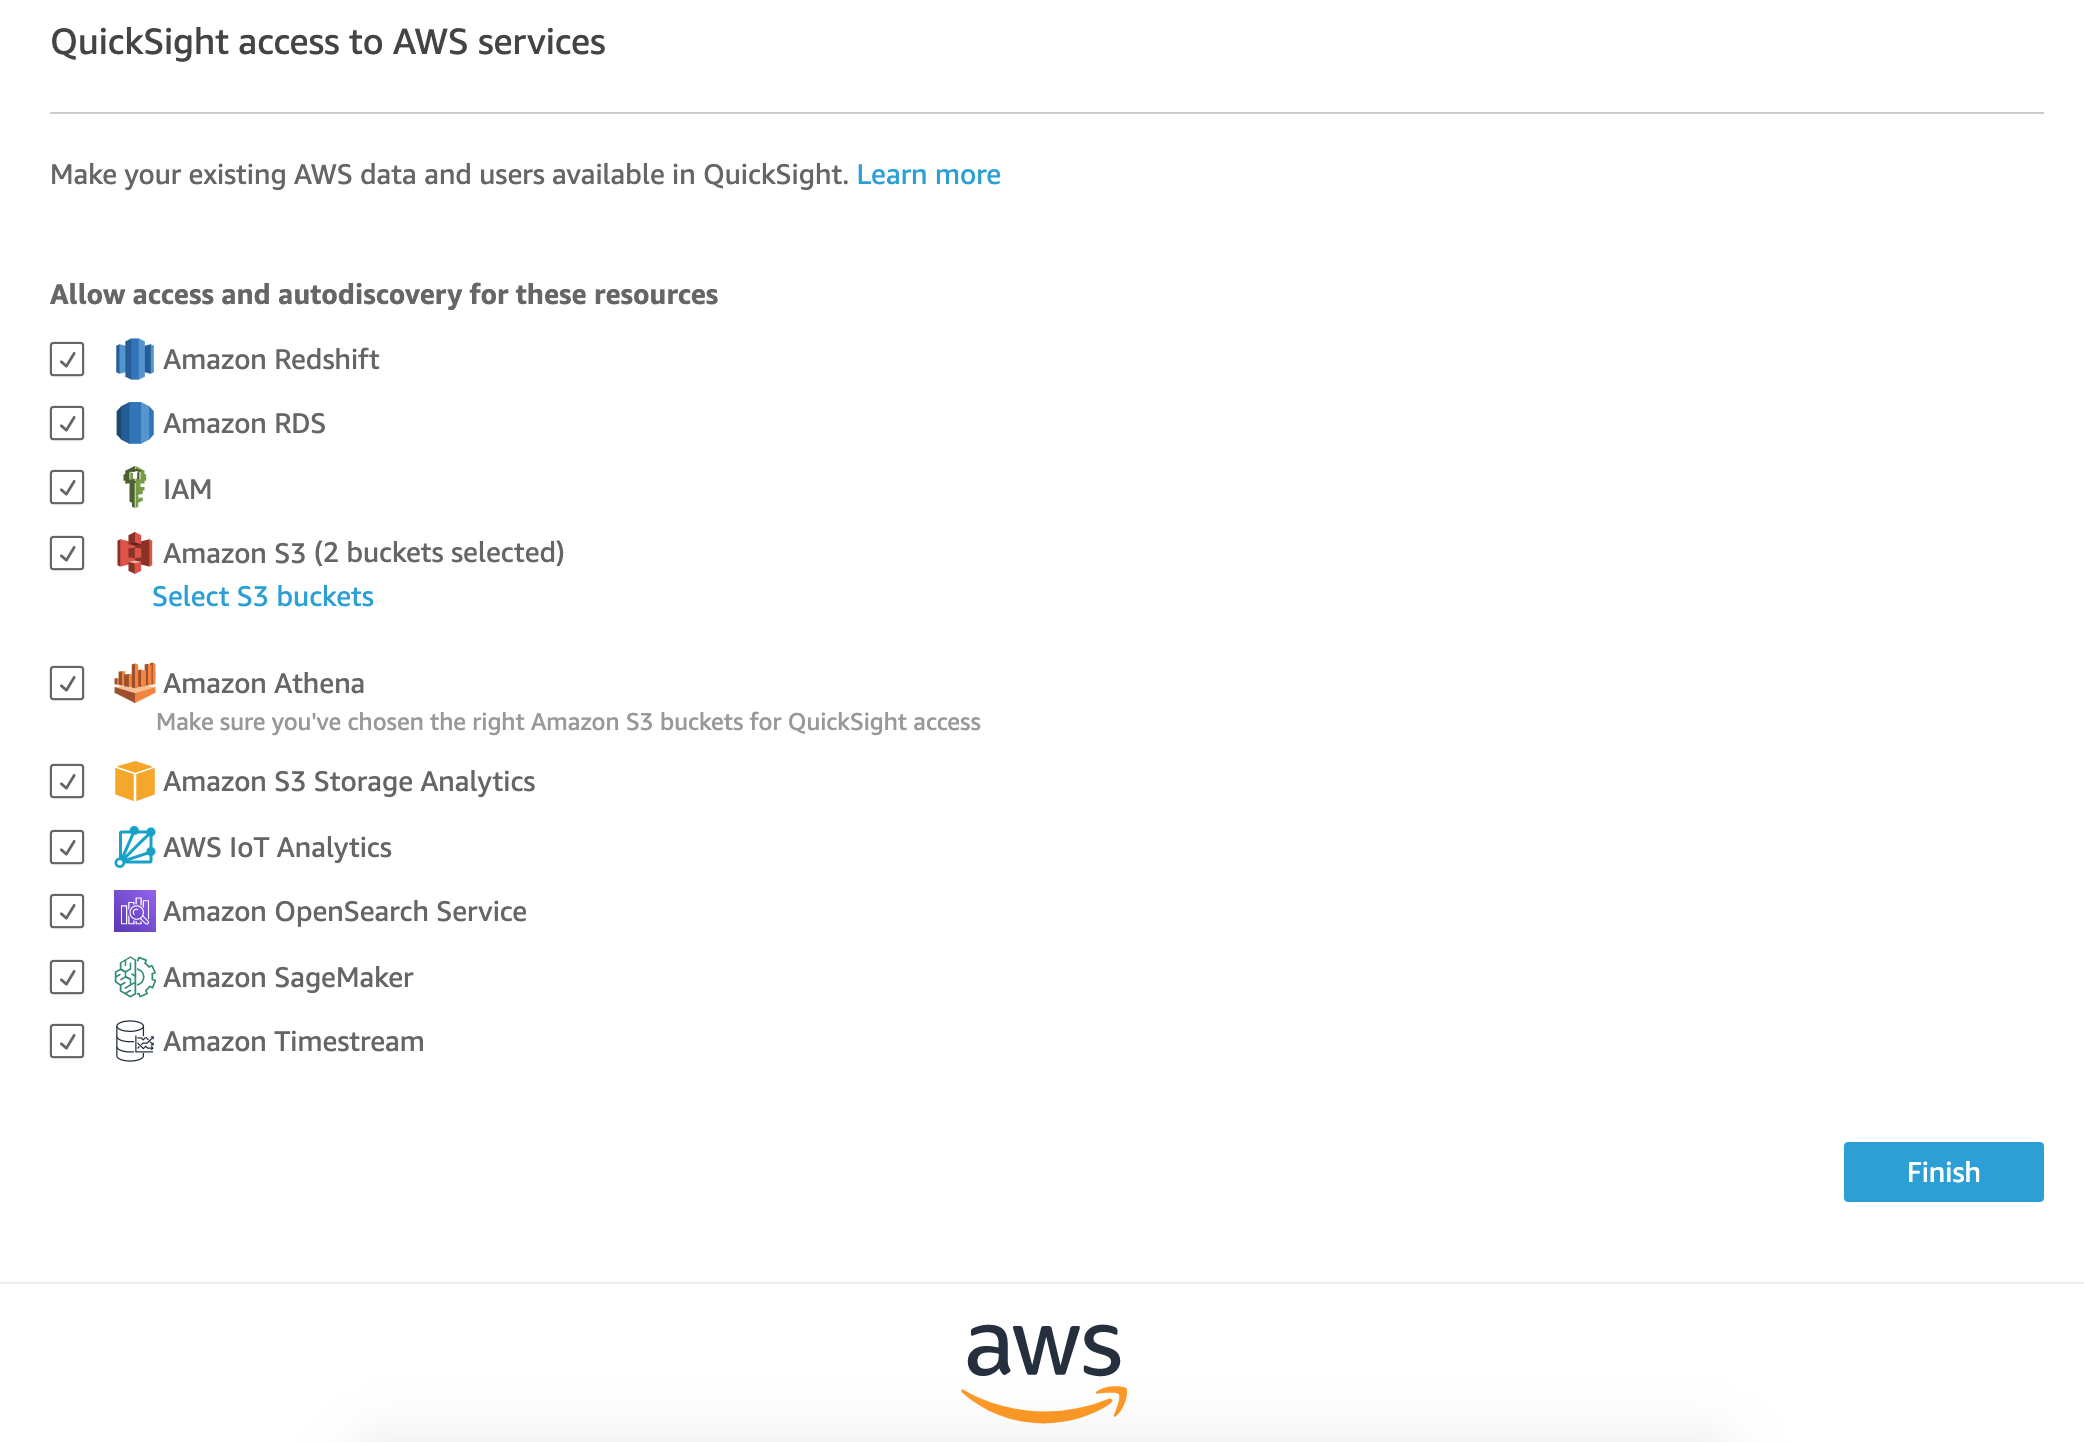
Select only those S3 Buckets you would like to grant access to QuickSight service. Finally click on Finish button.
Once account creation is successful, click on Go to Amazon QuickSight button.

Let us now setup Athena Datasource, & perform some basic analysis.
Now go to the Data Access tab and click on New Dataset.

QuickSight can access various Data Sources like Athena, S3, Redshift, RDS, Aurora and many more databases & services.
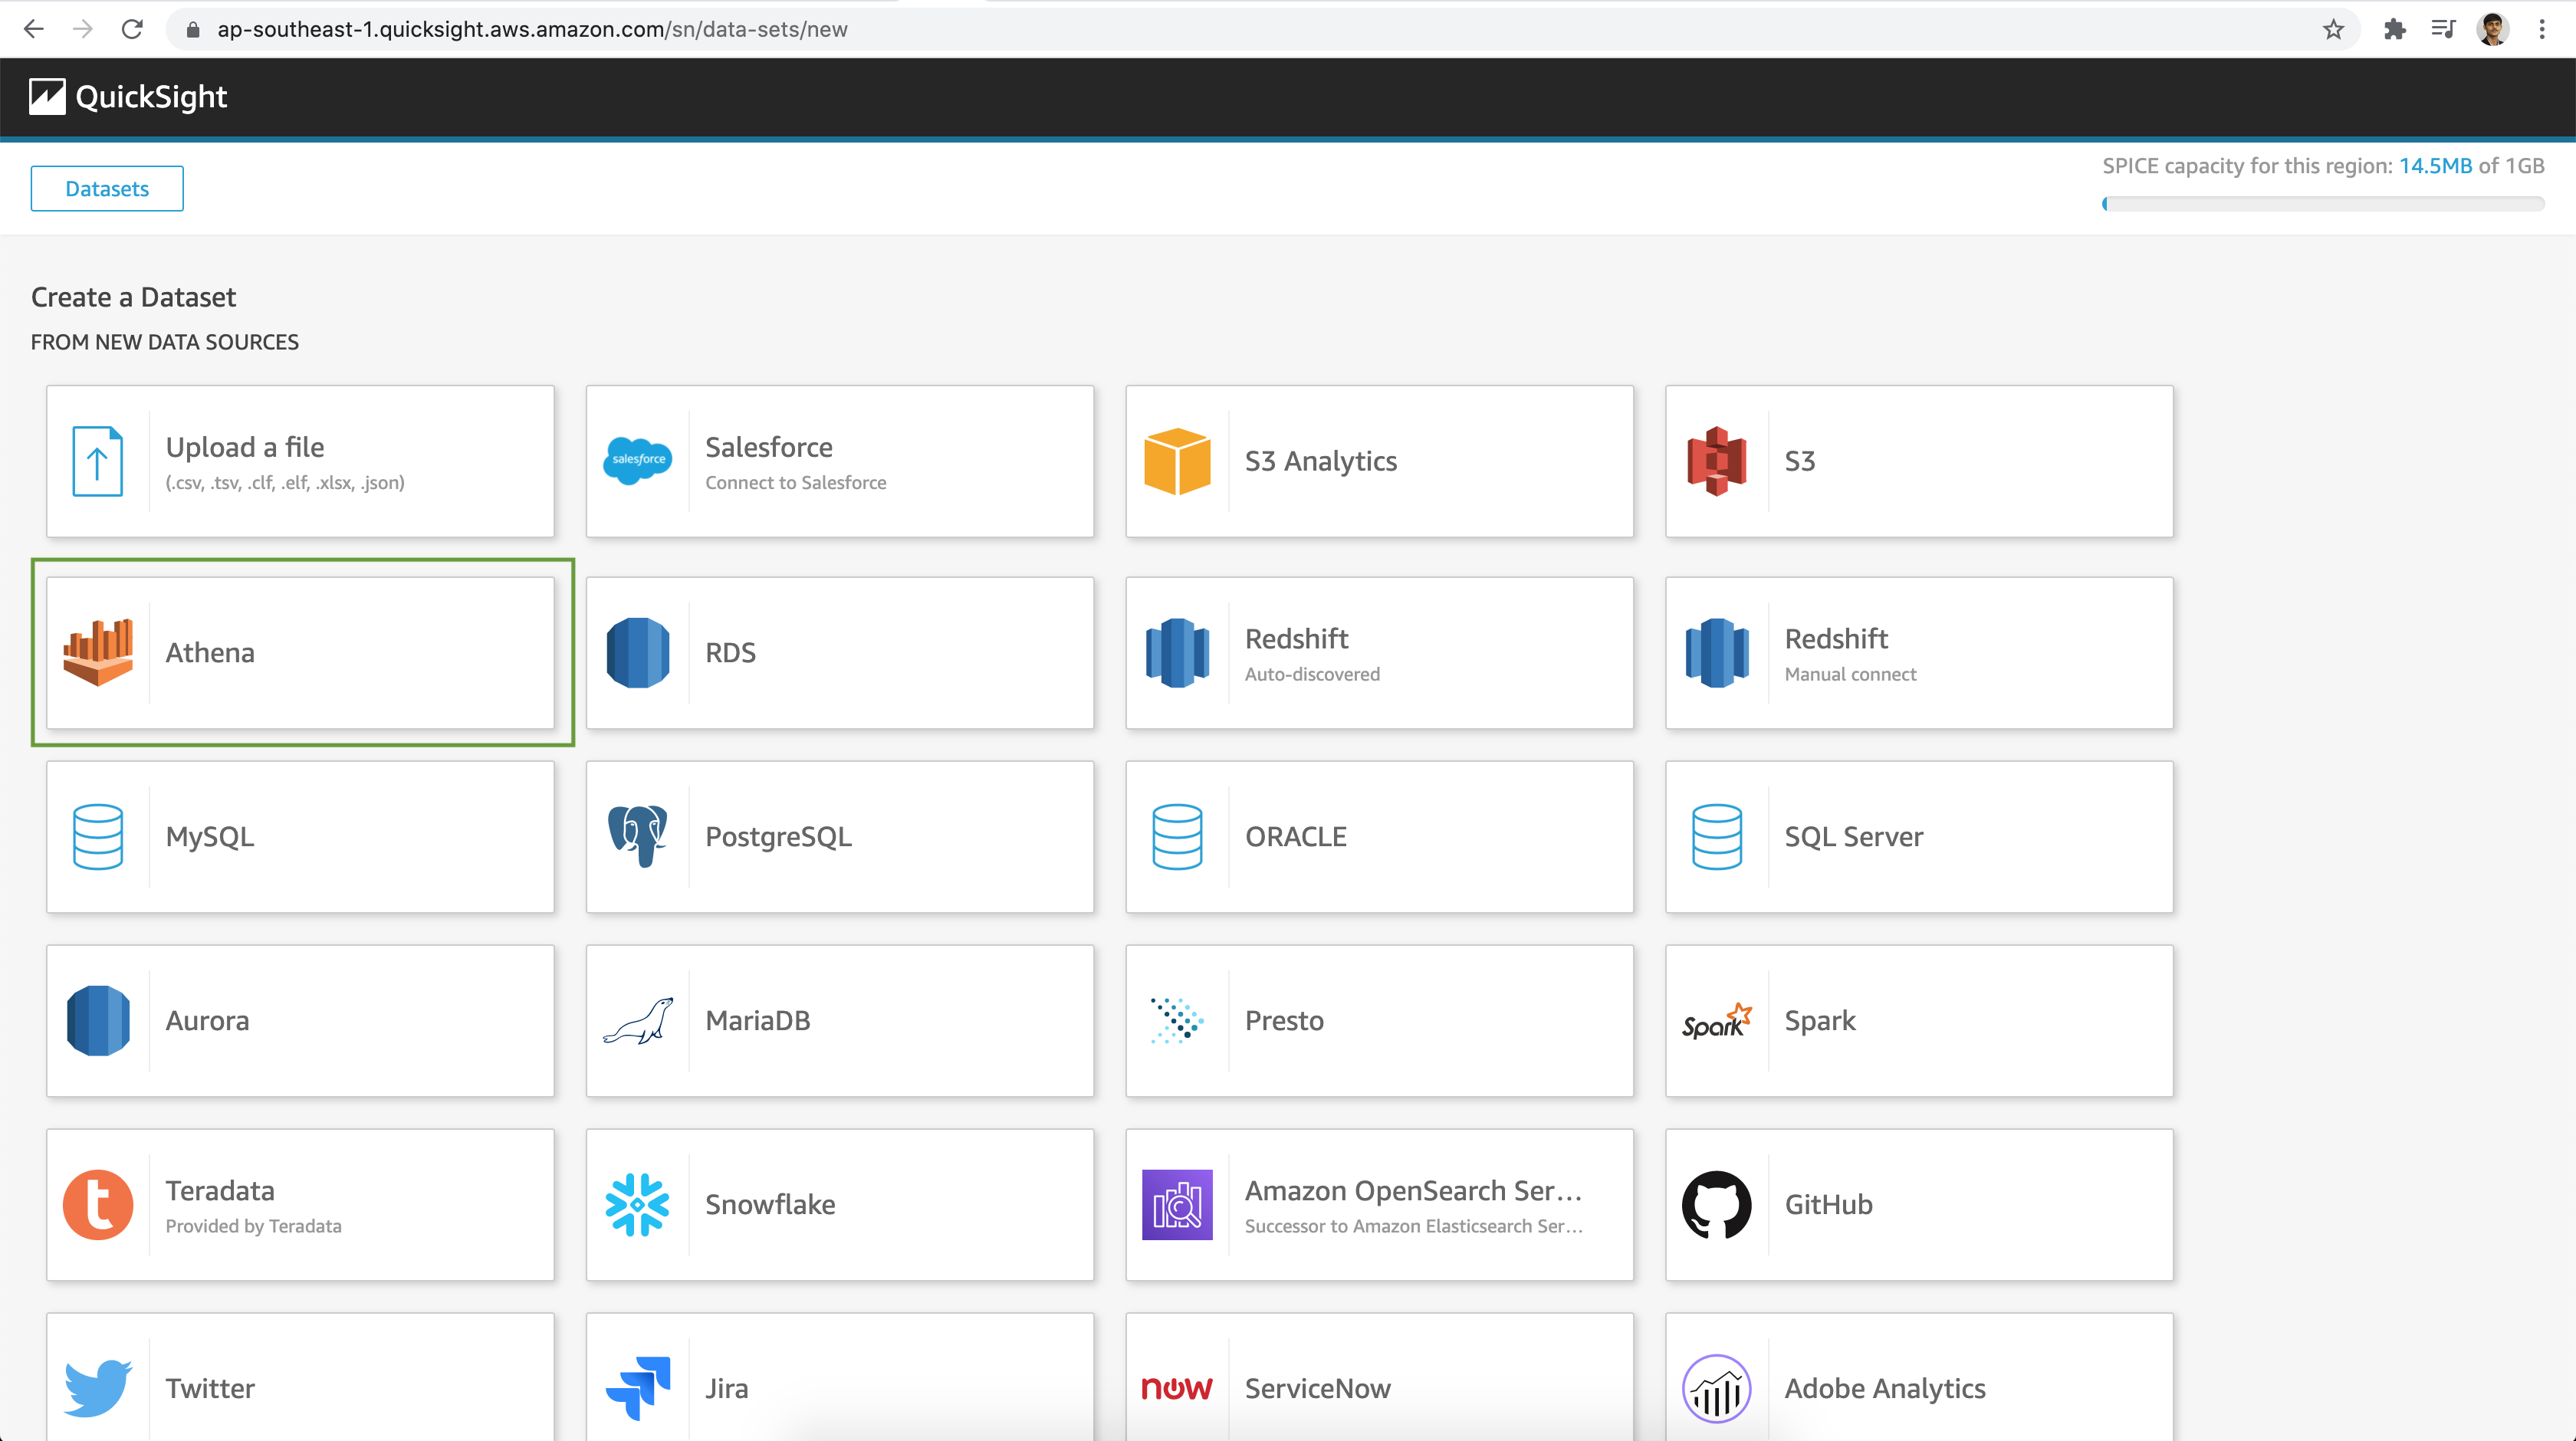
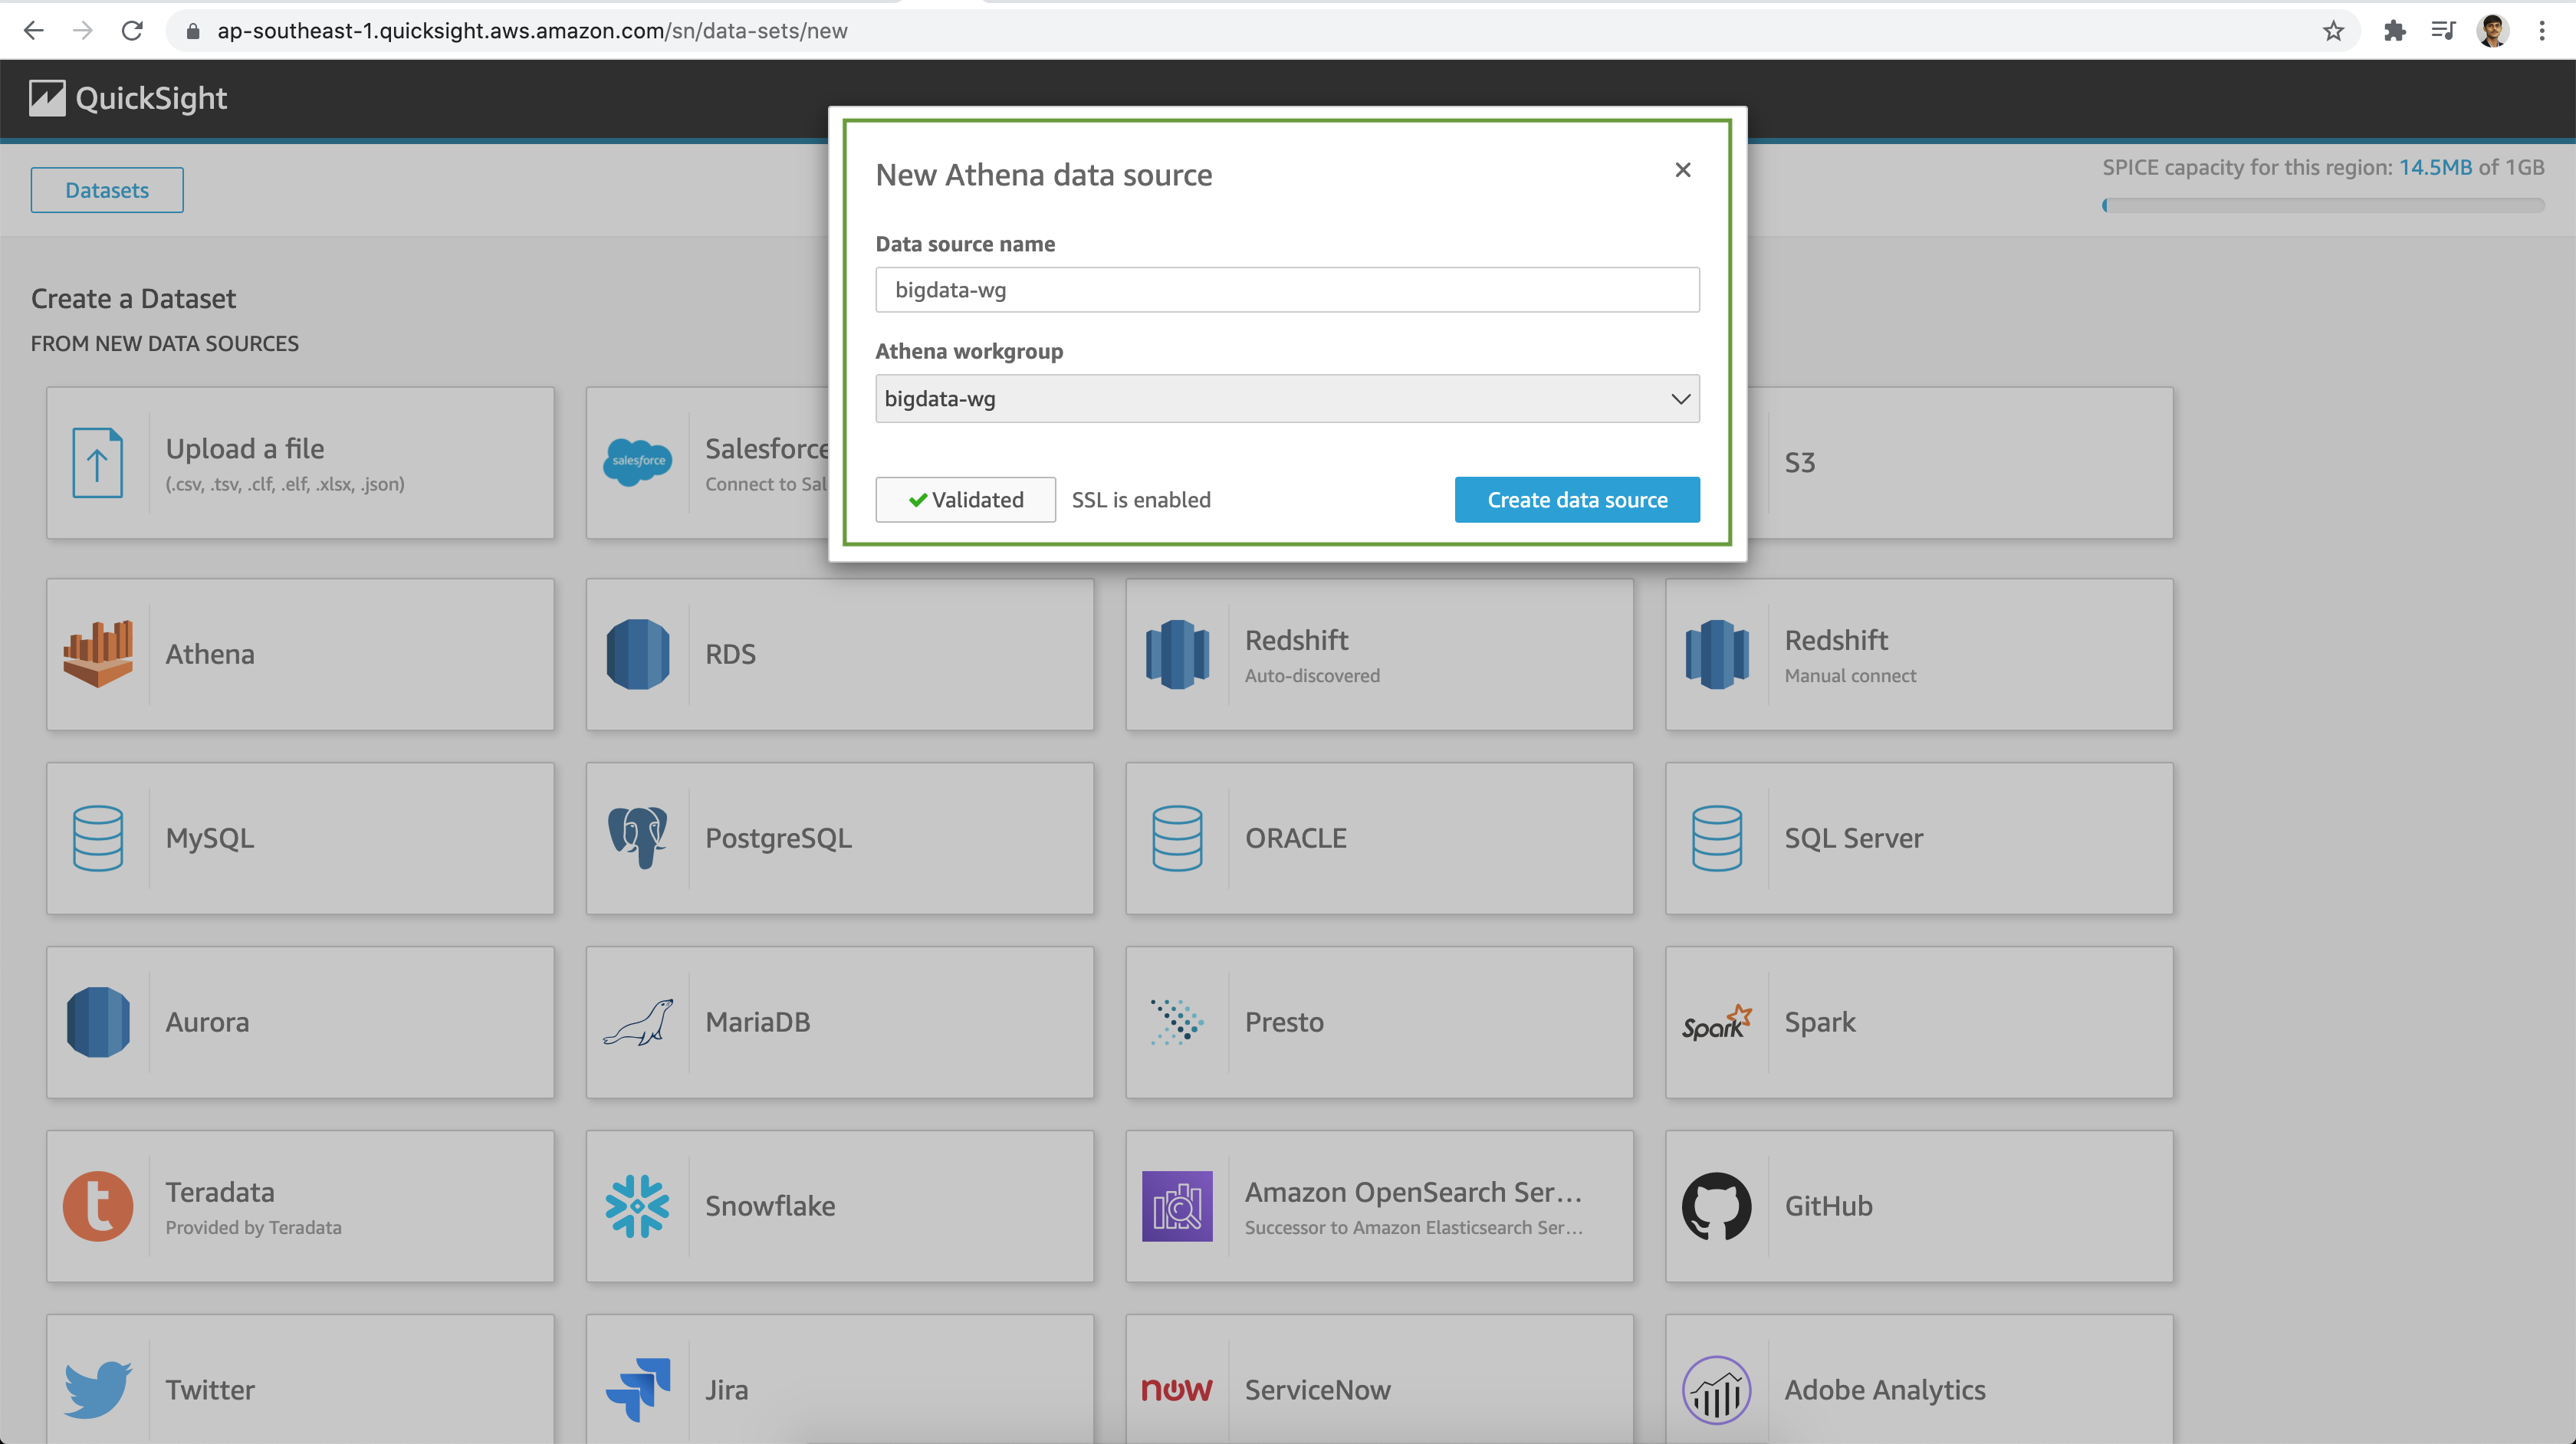
Select Athena as our Data Source. Next provide a Data source name and select the Athena Workgroup we created earlier.
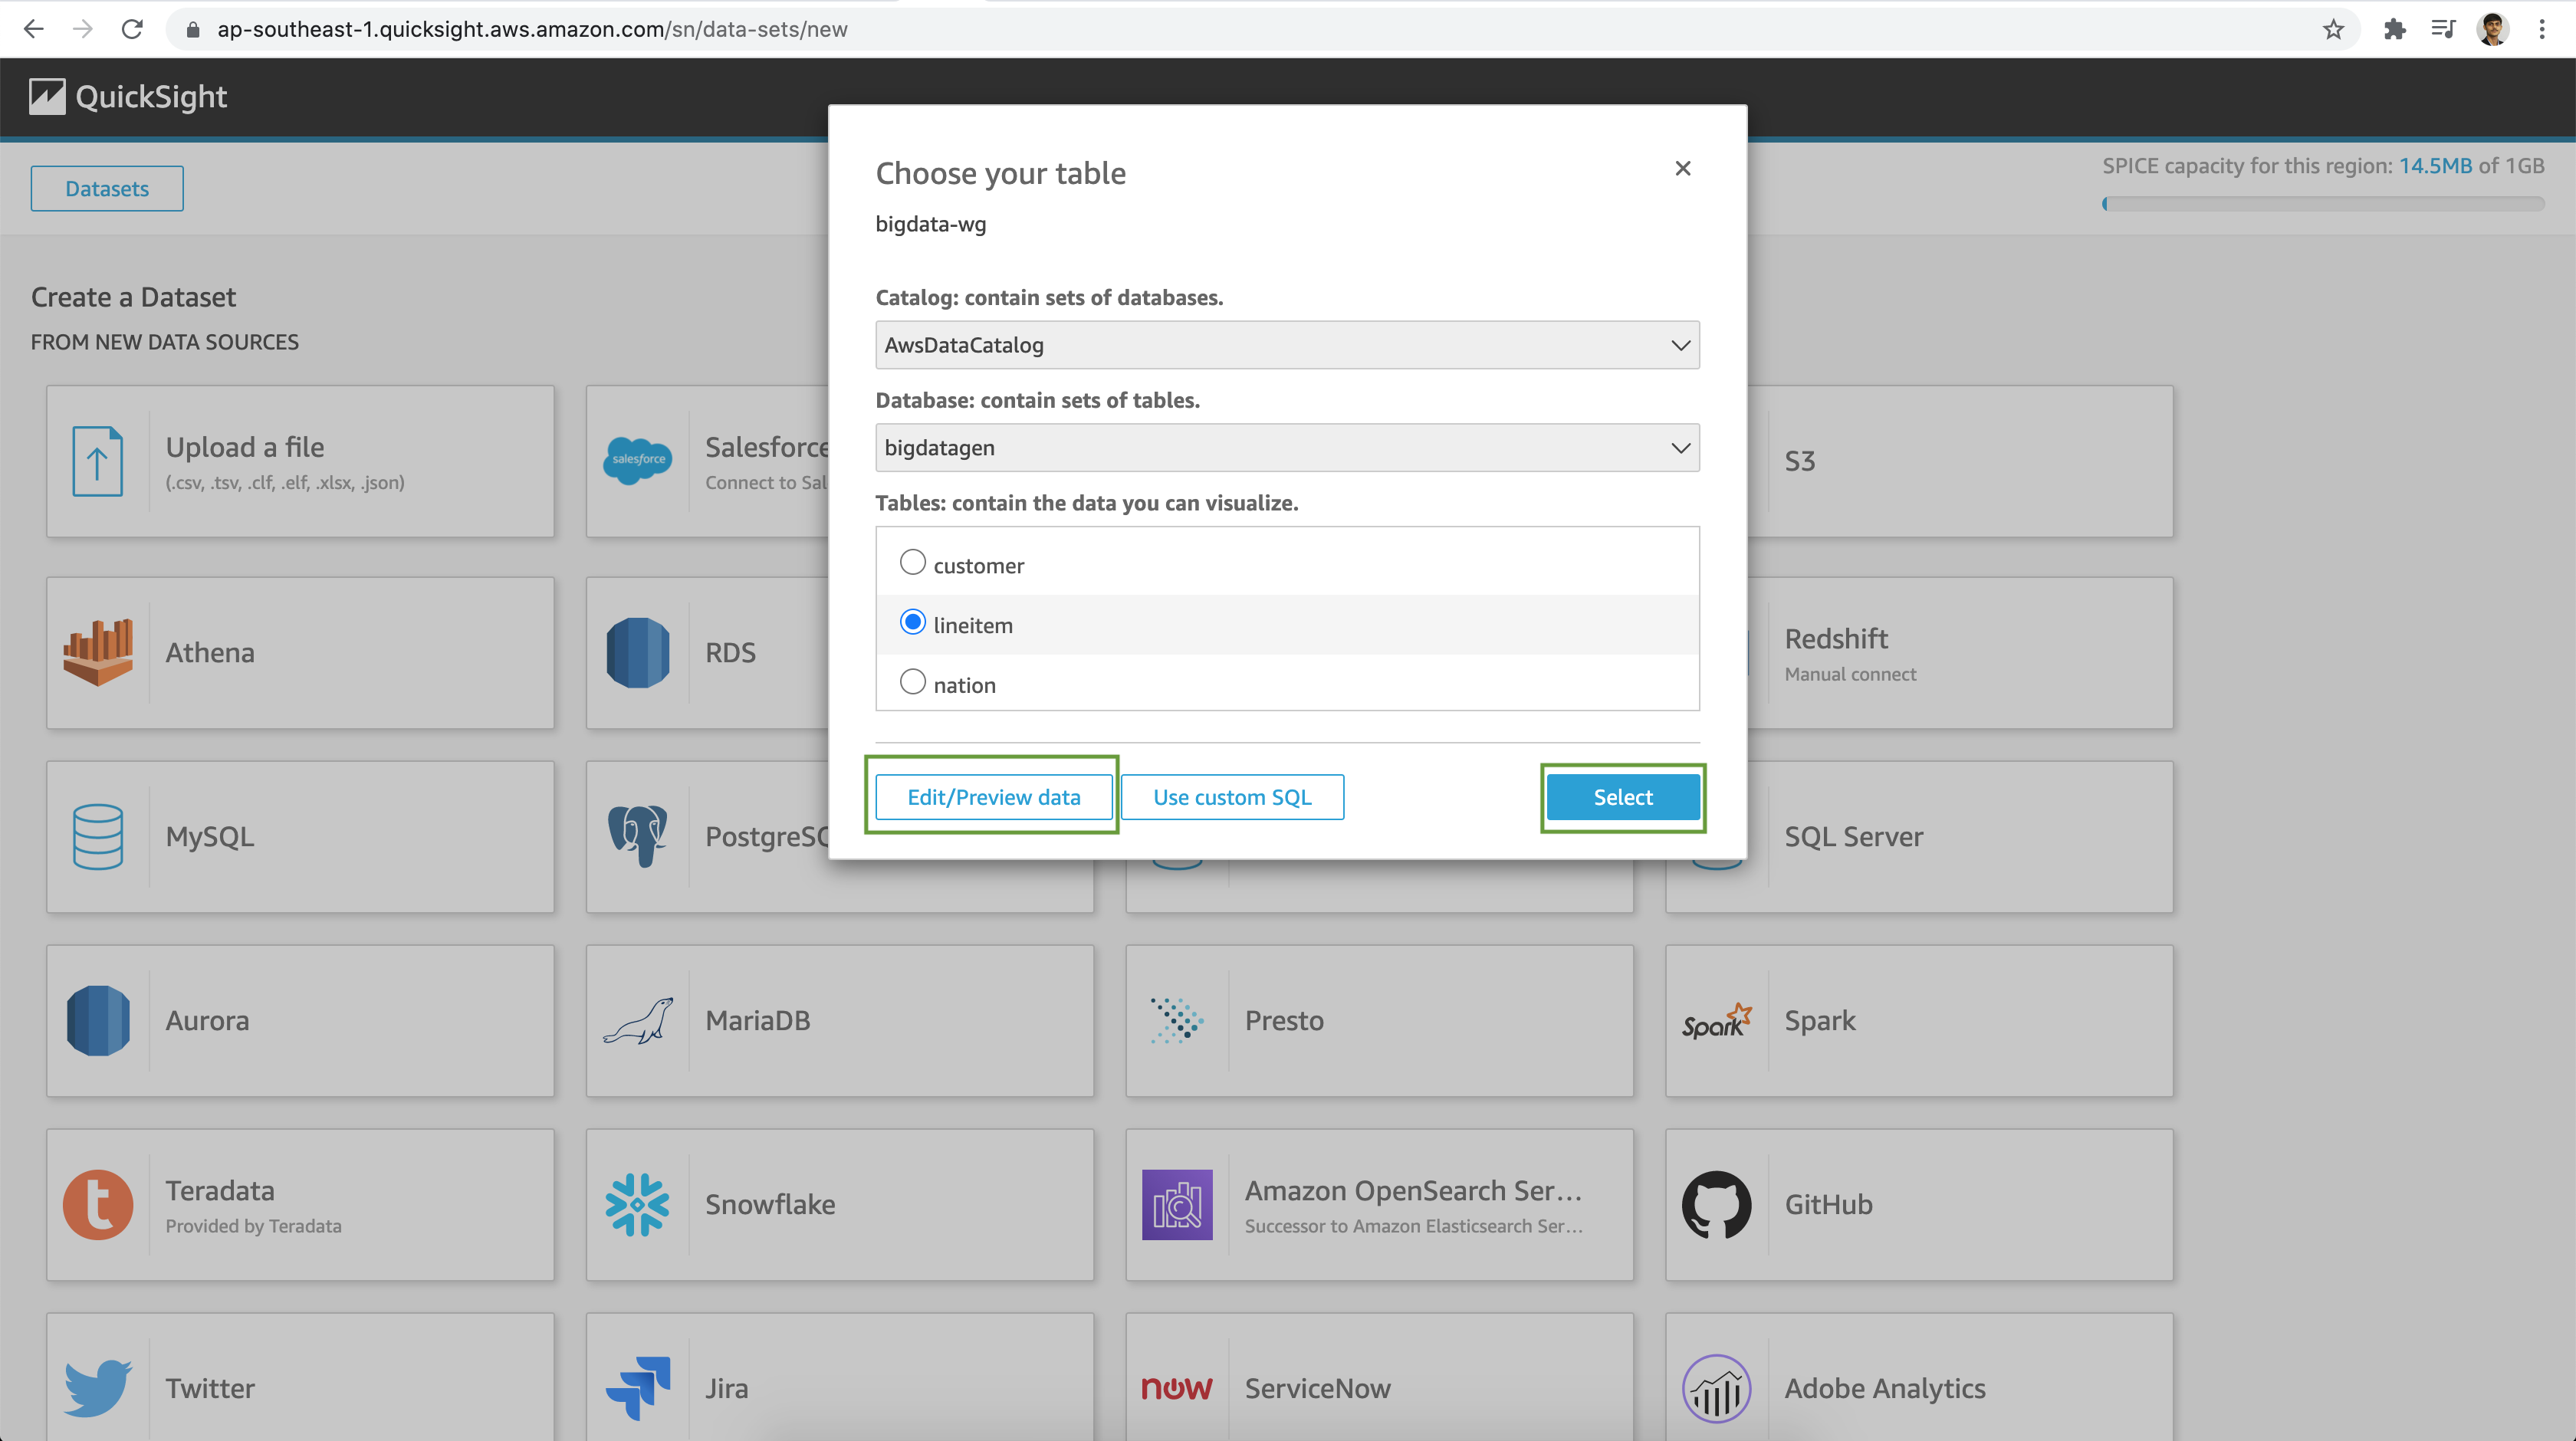
Next select the relevant Catalog and Database followed by the Table for analysis.
- Catalog: AwsDataCatalog
- Database: bigdatagen
- Table: lineitem
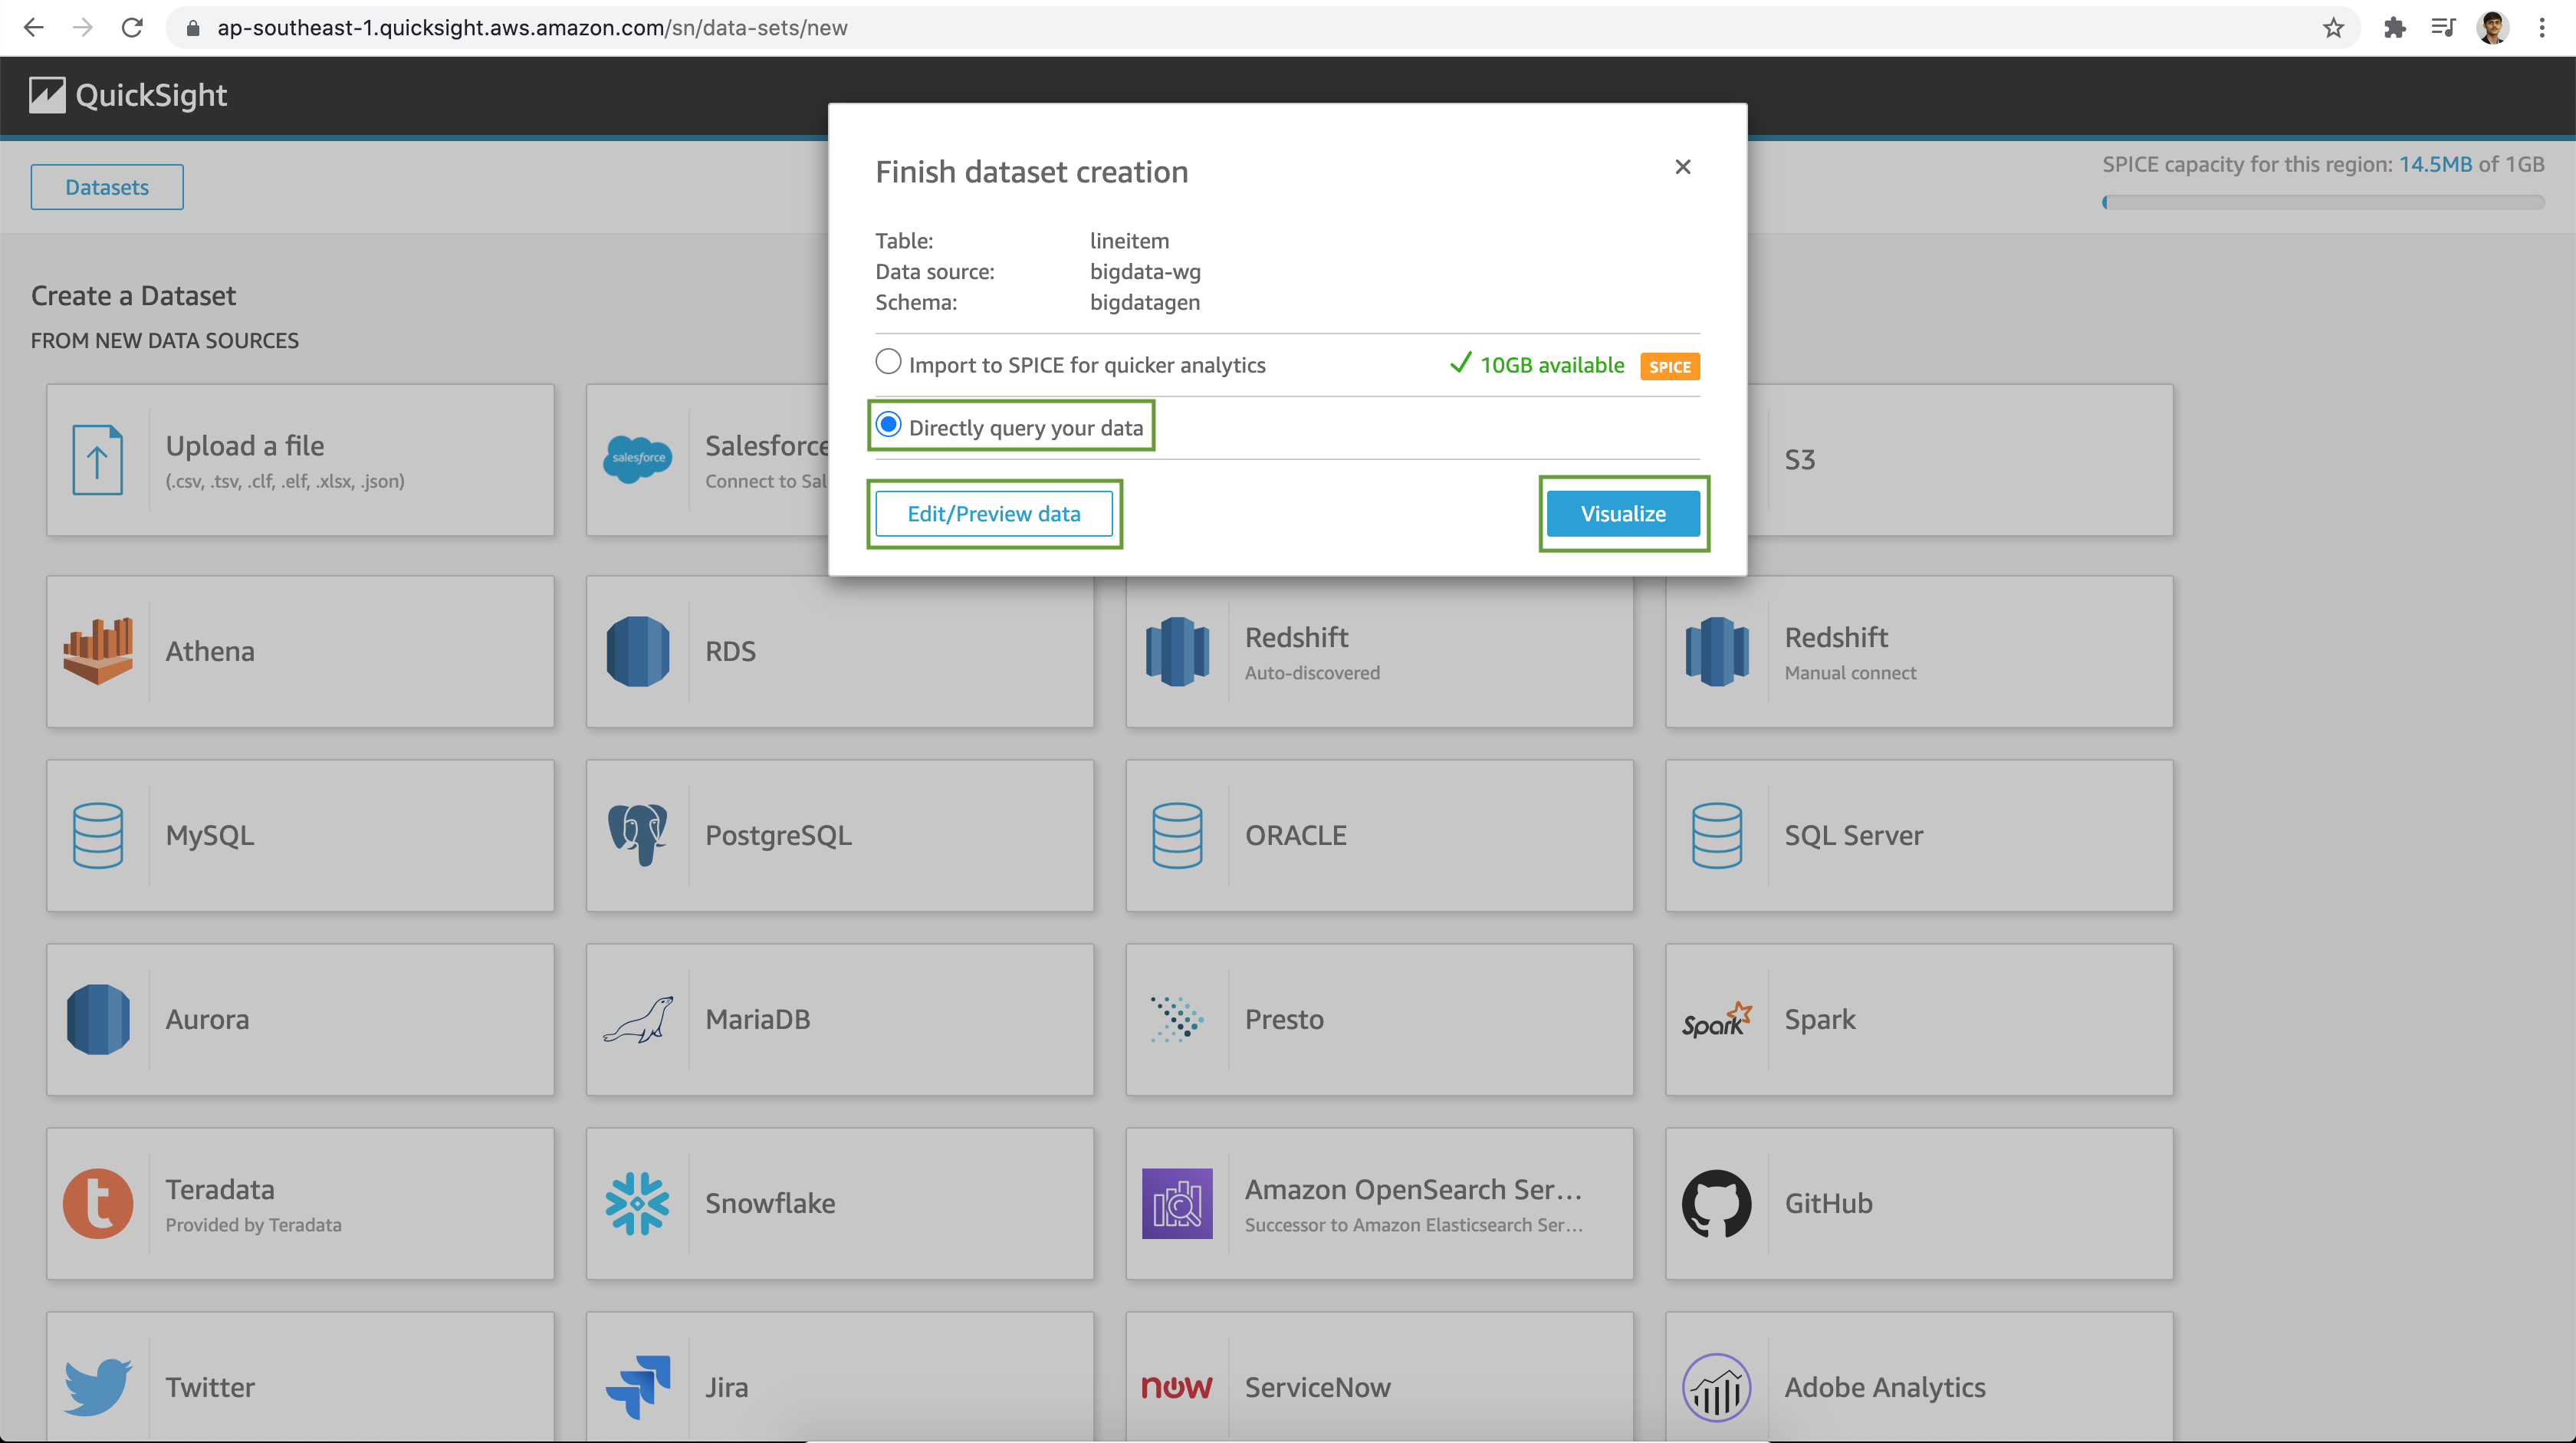
Amazon QuickSight uses SPICE - a super-fast Parallel, In-memory Calculation Engine, to deliver blazing fast performance on datasets. Here you may choose to import the data to SPICE for faster analytics. Else you may select to query the source data directly.
Let's choose Directly query your data for our demo.
Now proceed to select the the Dimension attributes, Measure figures etc. to perform your analysis.
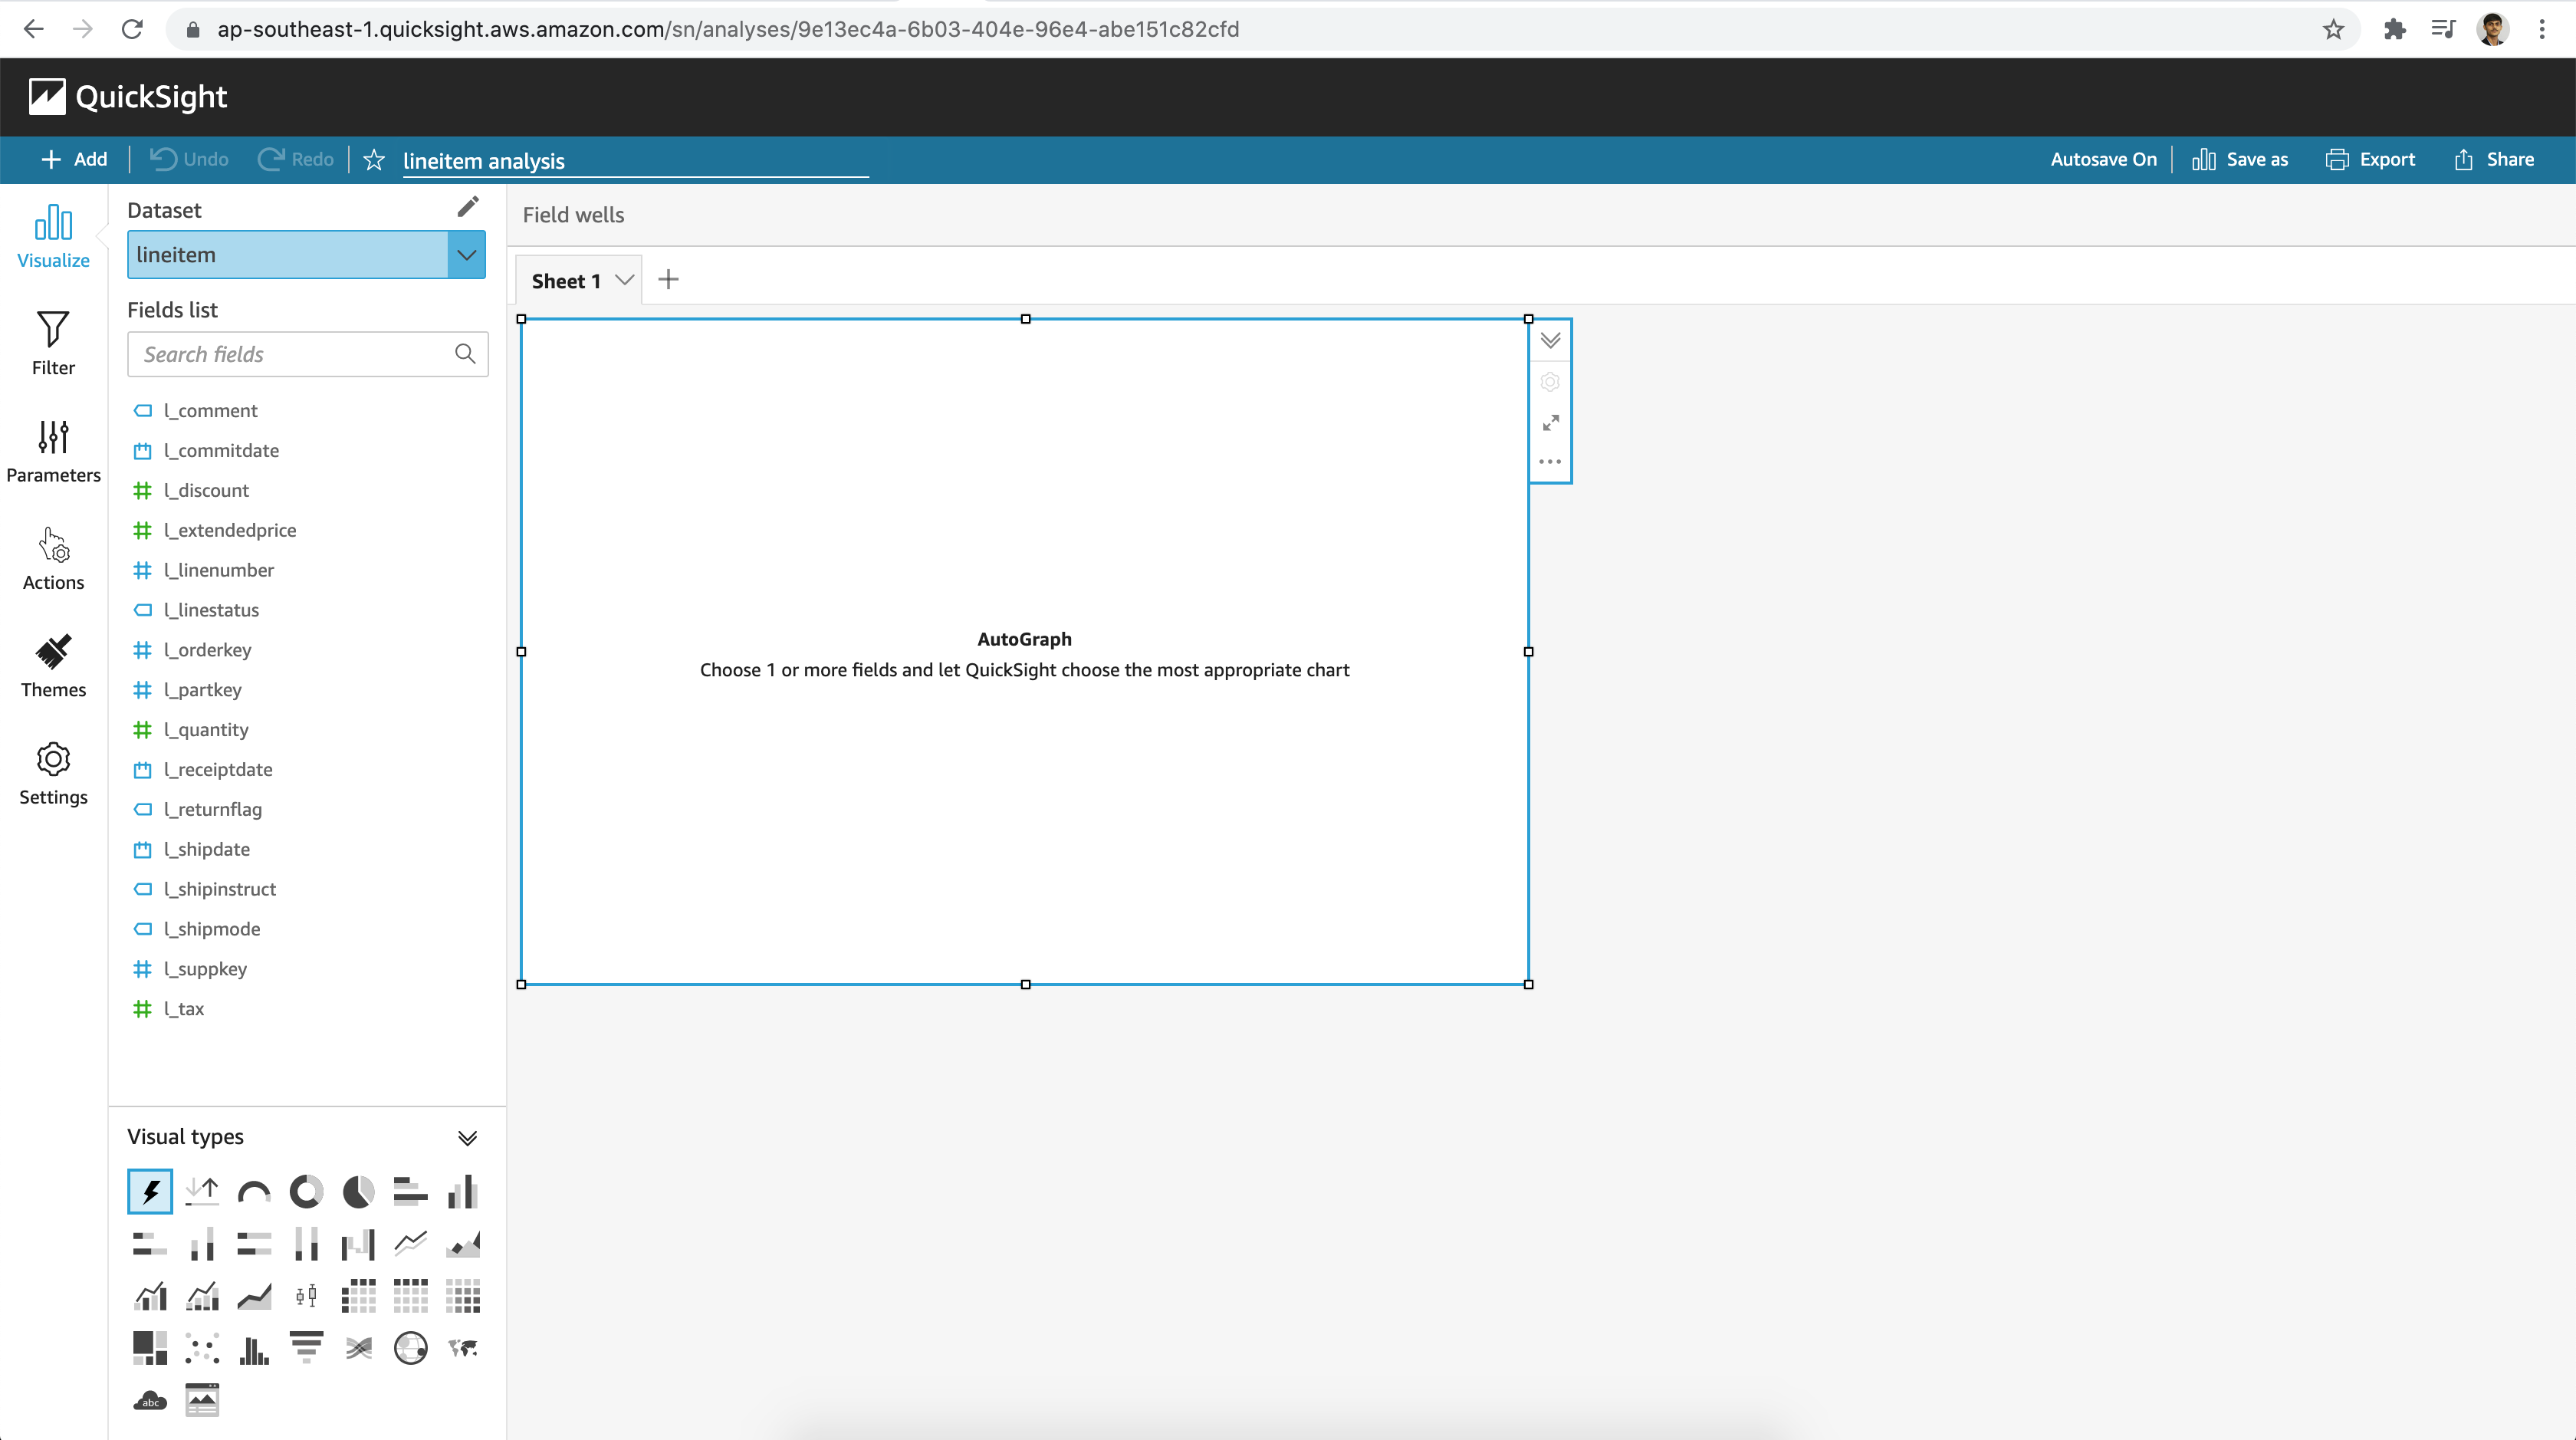
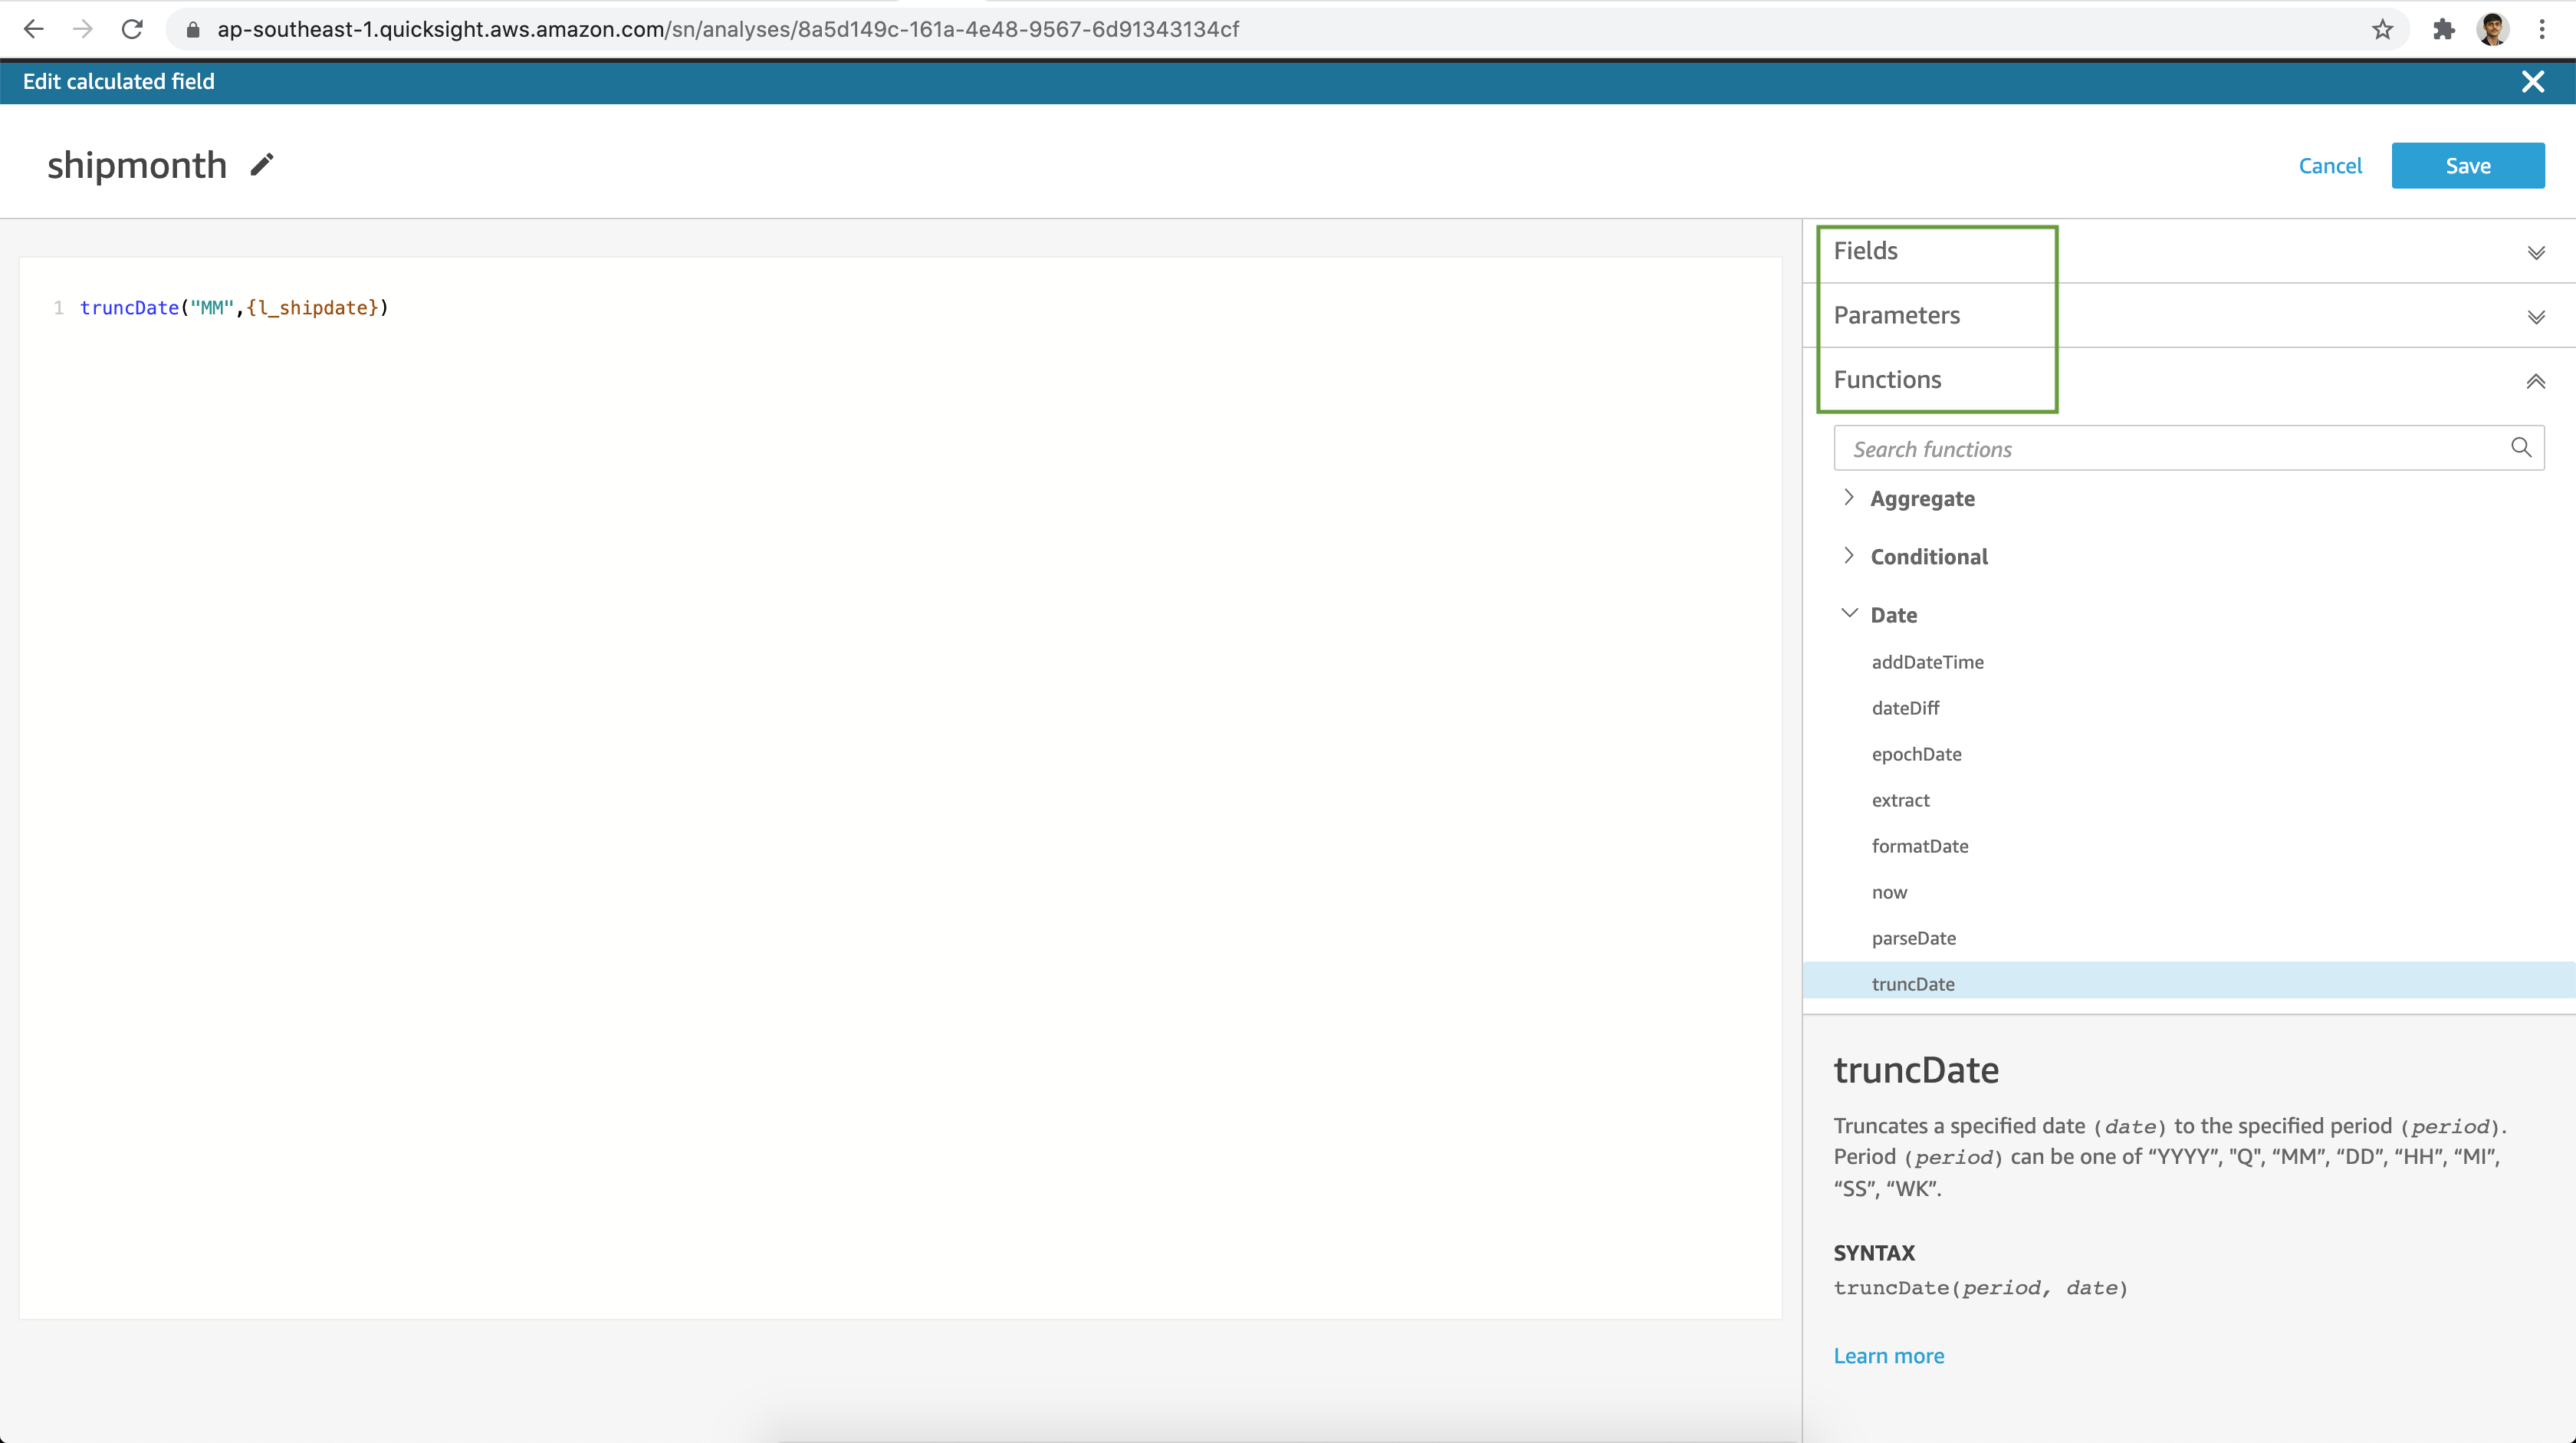
Play around with various Visualization types and other options available. I went ahead and created a calculated field. We have various functions to choose from to derive our relevant attribute or measure.
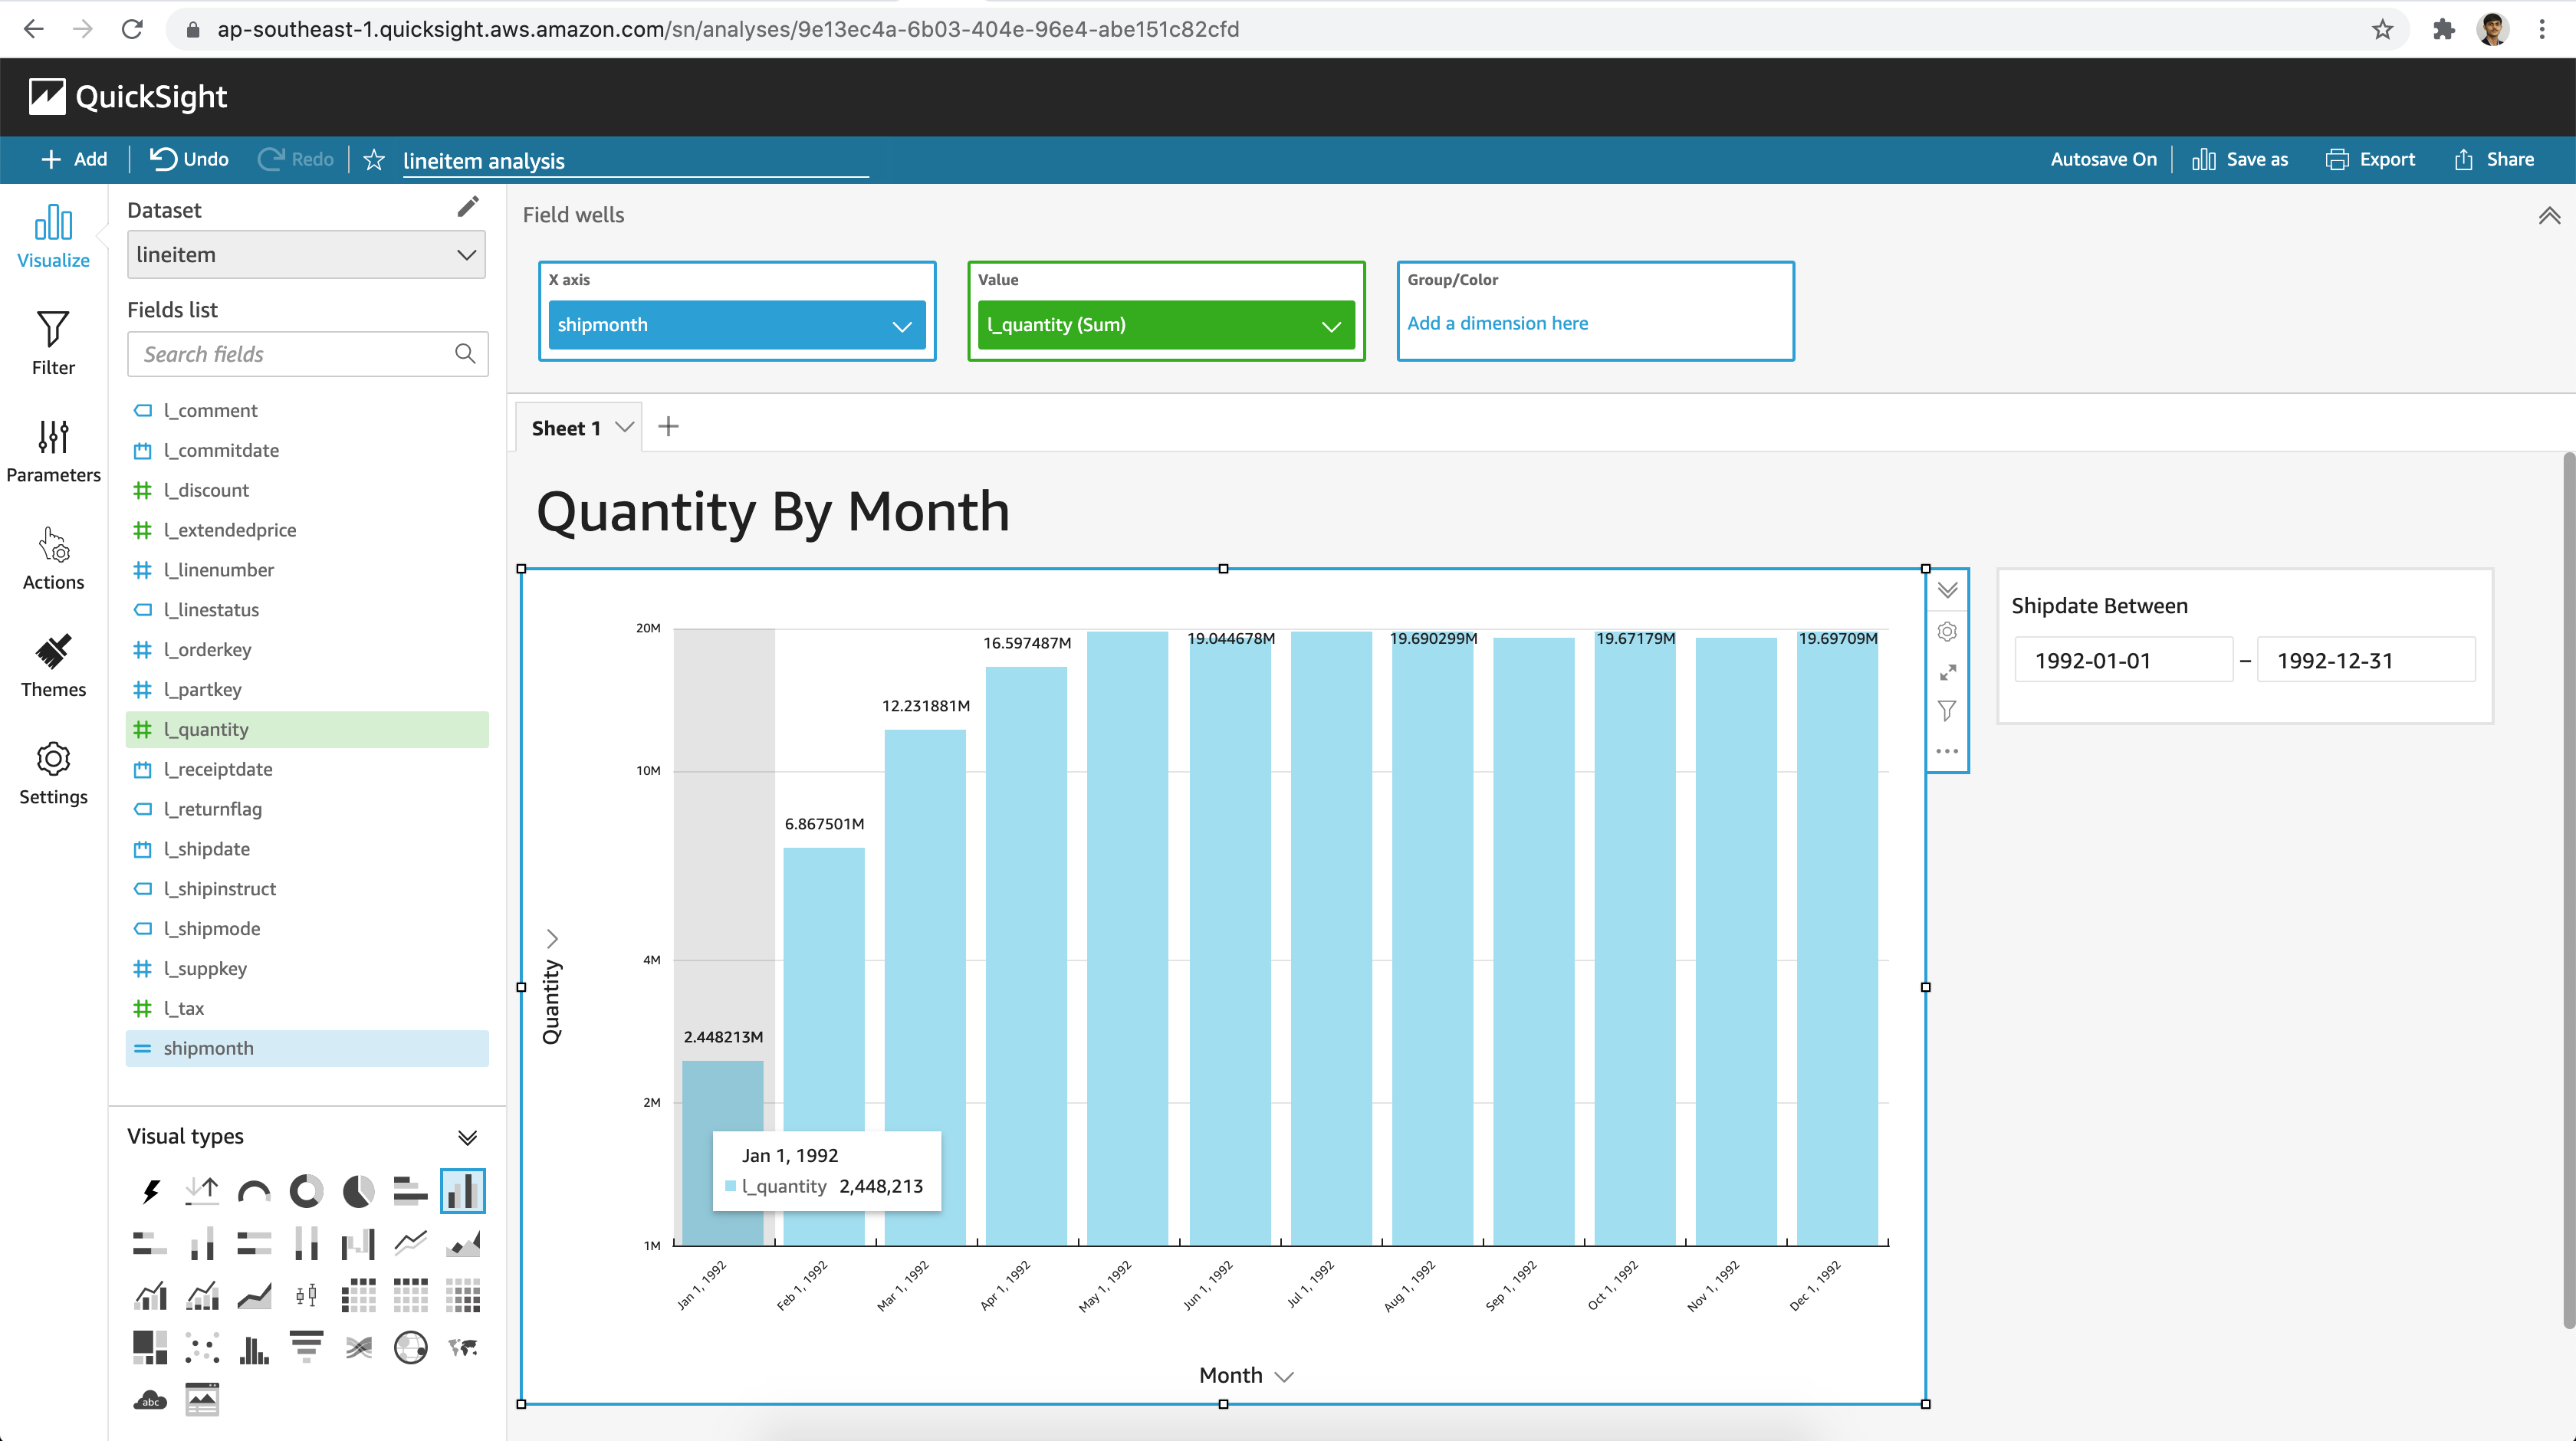
Next I filtered the dataset based on a dimension attribute and added a measure to my visualization as seen below.
Feel free to explore further, the various features & options available in QuickSight.

