
Getting Started with Pentaho Data Integration

Pentaho Data Integration or Spoon is a GUI workspace that allows us to create jobs and transformations to extracts data from heterogeneous sources, transforms that data using built-in steps and functions to meet business requirements and then can load the data into a wide variety of target databases or file systems for further analysis.
In this first PDI hands-on tutorial, we will use a data-set on the monthly number of rainy days in Singapore for a time frame between year 1982 to 2016. This data-set have comma separated values with 2 columns/fields, namely- month,no_of_rainy_days. So for each Year-Month the number of rainy days is available in this dataset. This data-set will help us to quickly get us started with the many basic PDI steps. Now let's list down our objective. We will extract the data from this csv file perform some transformation and load data in another flat file. Below are the steps we will be covering in this use case scenario.
- Read data from source csv file, using CSV Input
- Split Year-Month column to get the Year & Month component, using Field splitter
- Generate static list of values for Month Number & Month Name, using Add constant rows / Datagrid
- Perform a lookup to get the Month name corresponding to the month number, using Stream Value Lookup
- Select the columns from dataset to write to target file, using Select/rename Values
- Write data to flat file as pipe delimited using Text file output
- Get yearly total numbers of rainy days, using Group by
- Sort the data based on the most wettest year, using Sort rows
- Generate sequence number for each rows, using Get value from sequence
- Filter only the maximum wettest year, using Filter rows
- Write the result to execution log, using Write to log
- Parameterize Source & Target files directory, using Transformation properties- Parameters
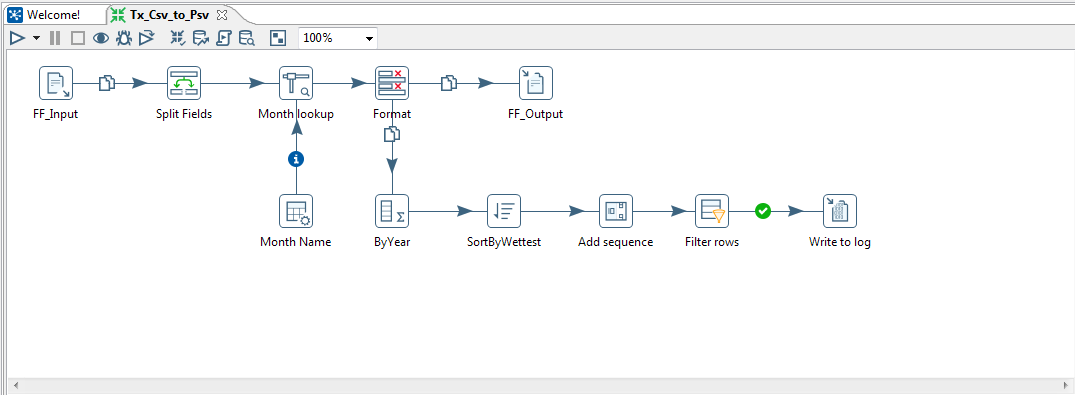
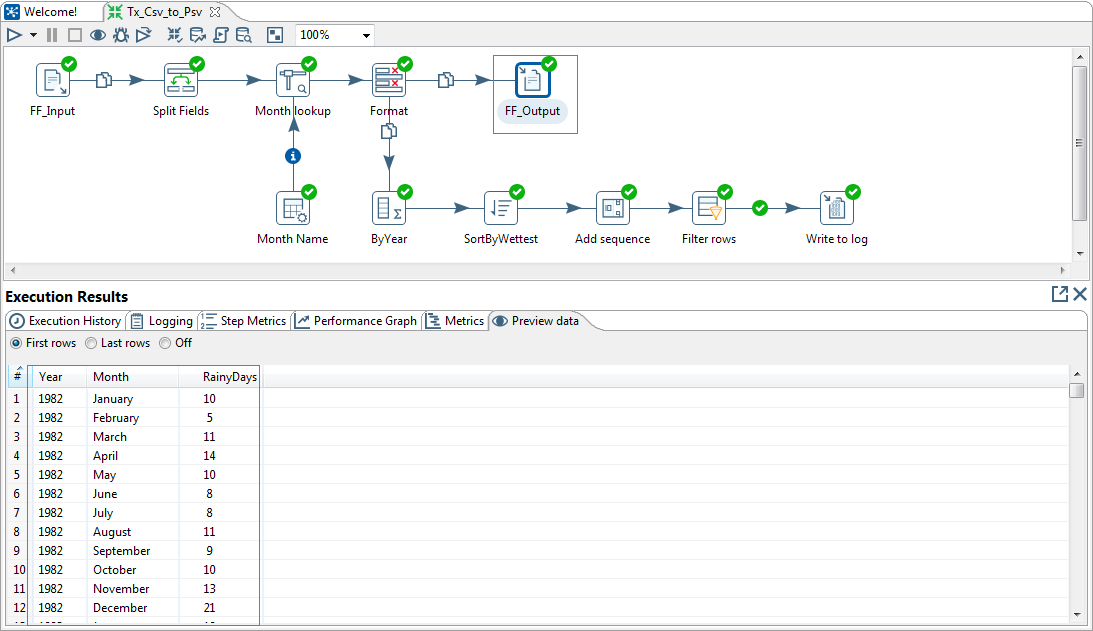
So let us first take a look how the overall PDI Transformation looks like. The Steps in this transform have already been listed above.
Now let's go through each of the Transformation Steps in brief. First we have our CSV Input step. Enter the Step name, let's say FF_Input. Next, click the Browse button to select the source csv file. Choose delimiter as "," (comma). We will uncheck the option Lazy conversion, to ensure proper datatypes assigned to the fields in files. Check the Header the present as yes. Now click on the button Get Fields. Enter the number of lines/sample size to scan, or leave default as 100. PDI will read through the sample records to determine the correct datatypes for the Fields. Finally ensure the fields, types, format, length & precision is set as per your requirement. Once done you may click on Preview, else click OK.
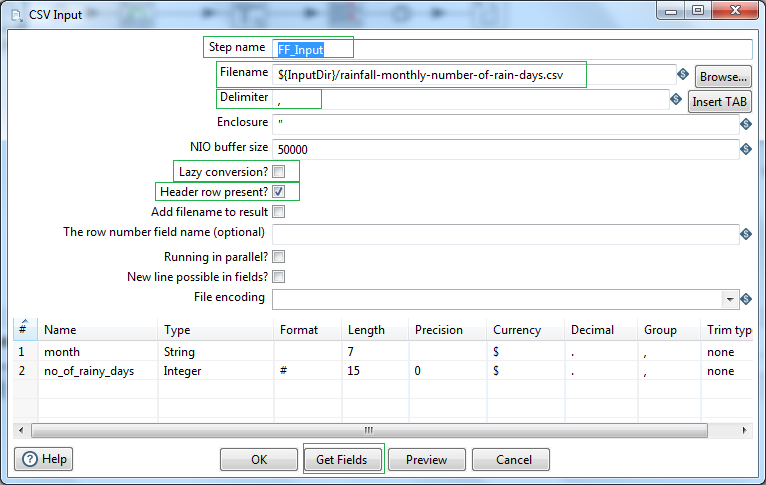
At a later point we will Parameterize the Source & Target directory paths of the data files, using Transformation parameters.
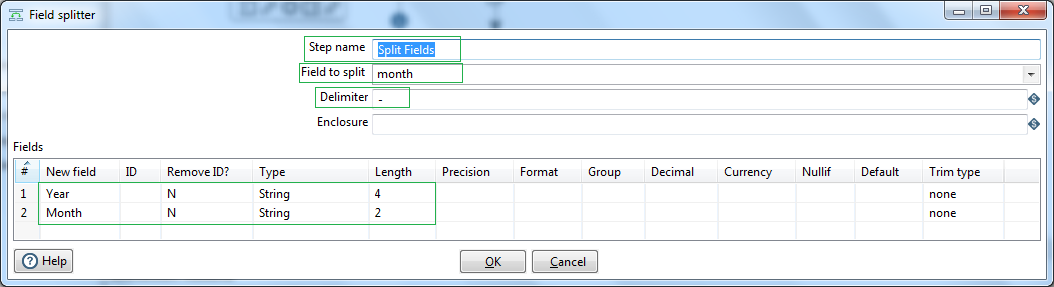
Our first field is year & month number, e.g. 1982-01. Let us split them into year and month strings using the Split fields step. Select the first column name as Field to split. Next, set the delimiter to "-" (dash). Define the output string fields as Year and Month respectively along with their suitable lengths.
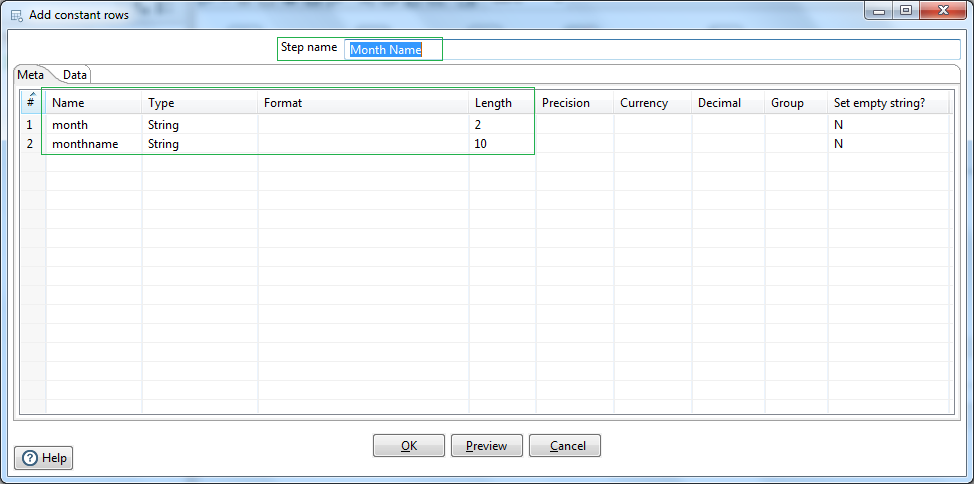
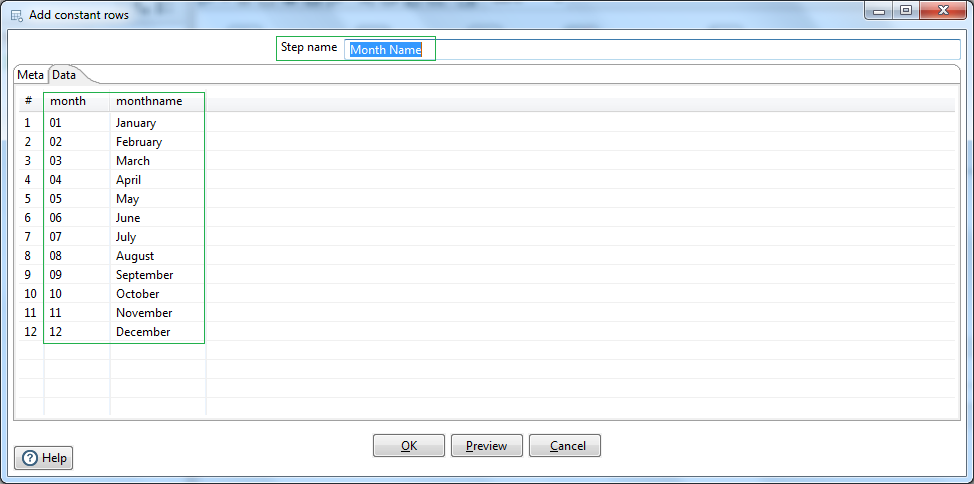
Next we will define constant rows of data for month number and corresponding month name using Add constant rows step. Name the step as Month Name. Define the field names and datatypes in the Meta tab. Next in the Data tab we set the constant rows for 12 months; e.g. 01 -> January. etc.
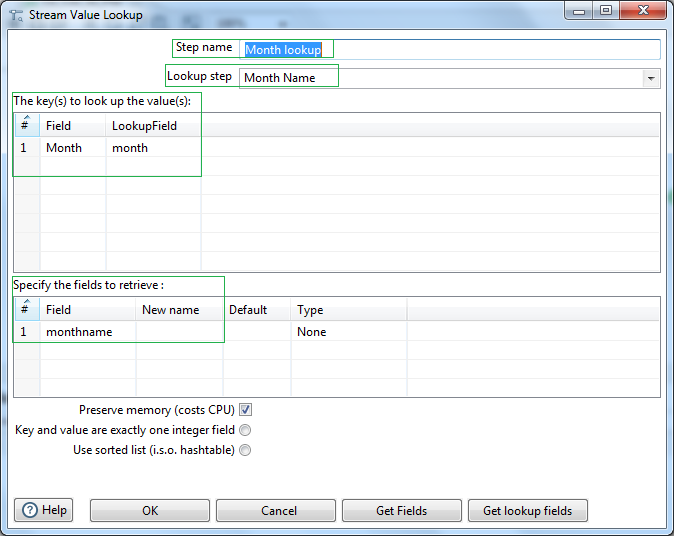
Now we have a lookup or reference dataset ready. Let us use PDI, Stream value lookup step to perform lookup of Month names based on matching Month number field values. Give a name to the step e.g. Month lookup. Use the reference datagrid Month Name as the Lookup step. Select the Month Number from Source field & lookup field as the Keys for lookup. Next select the Month name field from the lookup datagrid as the field to retrieve.Now our lookup setup is done.
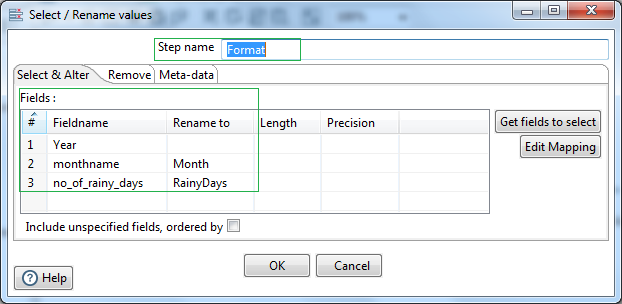
Next let us select the fields of our interest & rename them to be passed to the next steps. For that we will use the Select/rename values step.
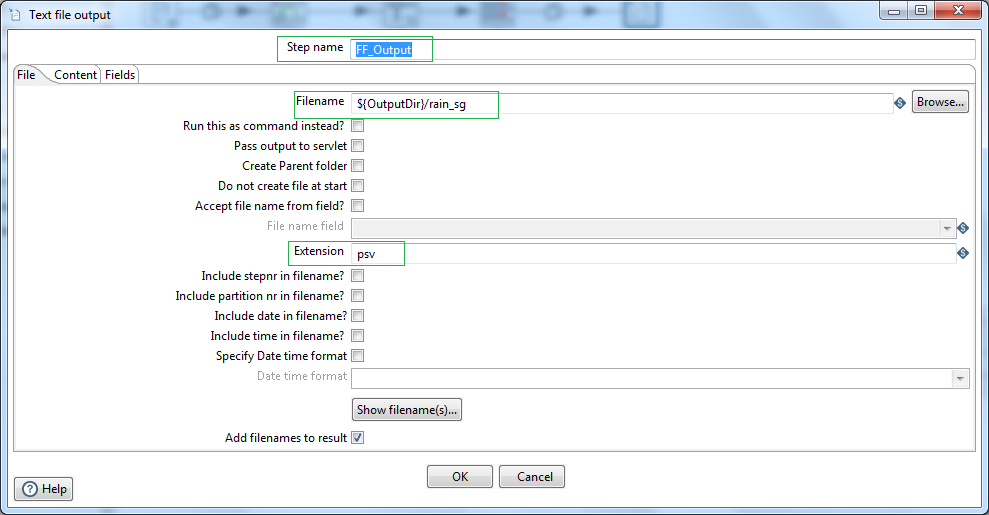
First let us load this transformed dataset to a flat file. For that we will use the Text file output step. Later we will create another hop connection to process the data further to get the wettest year. For that we will enable the hop to copy the data from the previous step i.e. Select/rename values step.
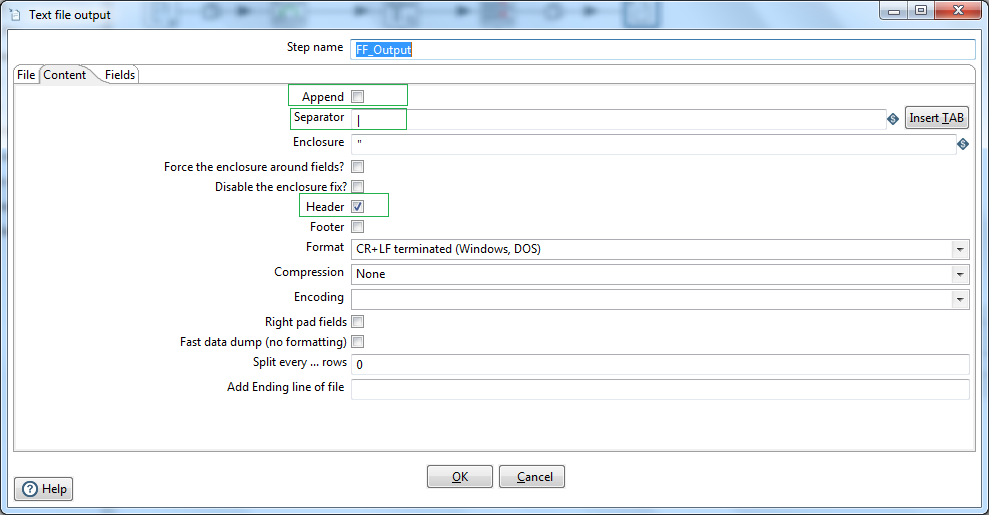
Name the Step as FF_Output. Browse the directory and provide the output file name. lets say /user/desktop/output/rain_sg. Put file extension as psv. Later we will parameterize the file path. Next click on the Content tab.
Insert data separator character as "|" (pipe). Check Header, to generate header record with column names in the file.
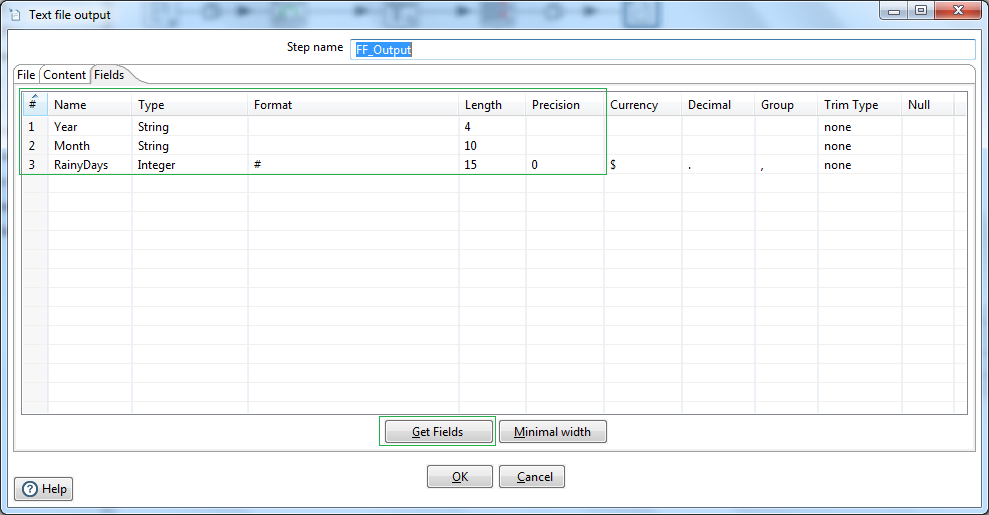
Next select the Fields tab. Click on the Get Fields button. If required delete fields, format data fields, move the fields up and down based on the requirement. So our first data pipeline is ready. We have read csv data file performed lookup and finally loaded the data in flat files using PDI.
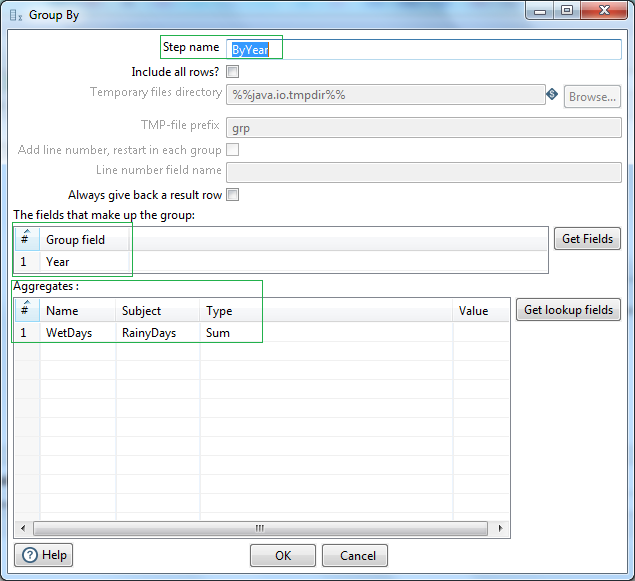
Now let us create another pipeline to write a record to log file the wettest year in the given dataset. Firstly use a Group by step, and let's name it as ByYear. Next select Year as Group field. In the Aggregates create a field namely WetDays as the aggregate sum of RainyDays. So now we have a dataset with respective Year and sum total number of rainy days.
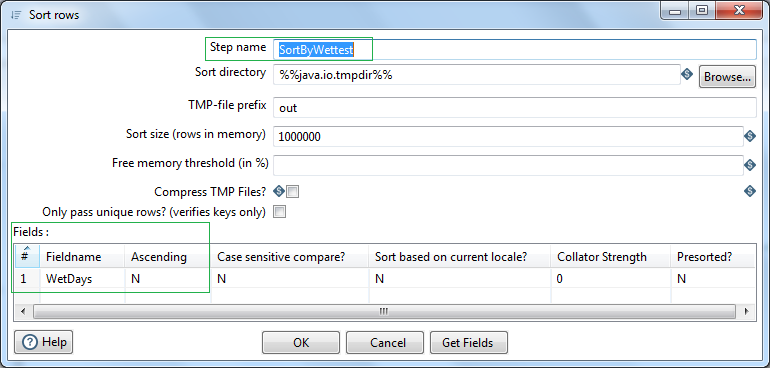
Let us now use a Sort rows step, to sort the data based on descending order of the field WetDays. Let's name the step as SortByWettest. In the fields area, select WetDays field and set Ascending as "N" (No). So now the data set will be reverse sorted based on the maximum wettest days yearly.
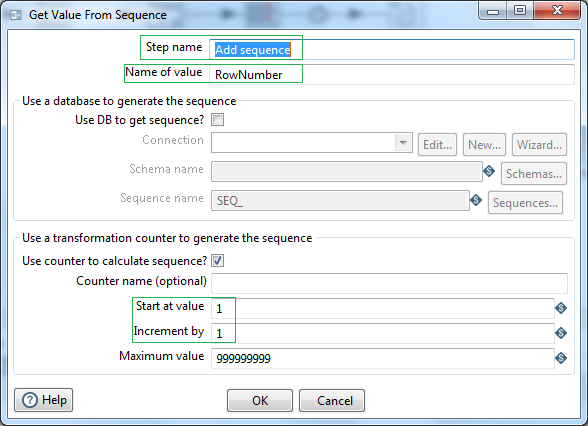
Use a Get value from sequence step, to generate sequence number to our dataset. Let's name the ouput sequence field/Name of value as RowNumber. Set start at value 1 and Increment by 1.
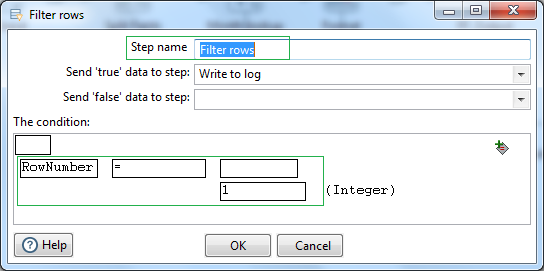
Now let us simply filter out the first record. i.e. where the RowNumber value is 1. This record will have the wettest year and number of days it rained for that year. Use a Filter rows step to filter out this record. Set field RowNumber equal to value of integer 1.
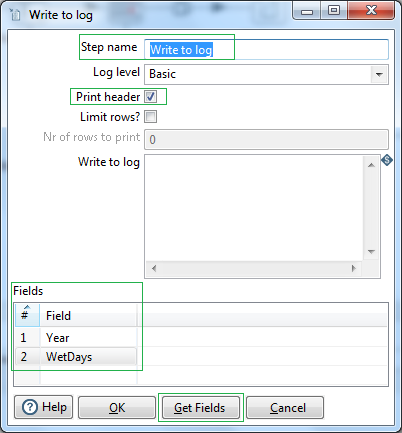
Connect the True result hop next to a Write to log step. Select the fields to write to the log file.
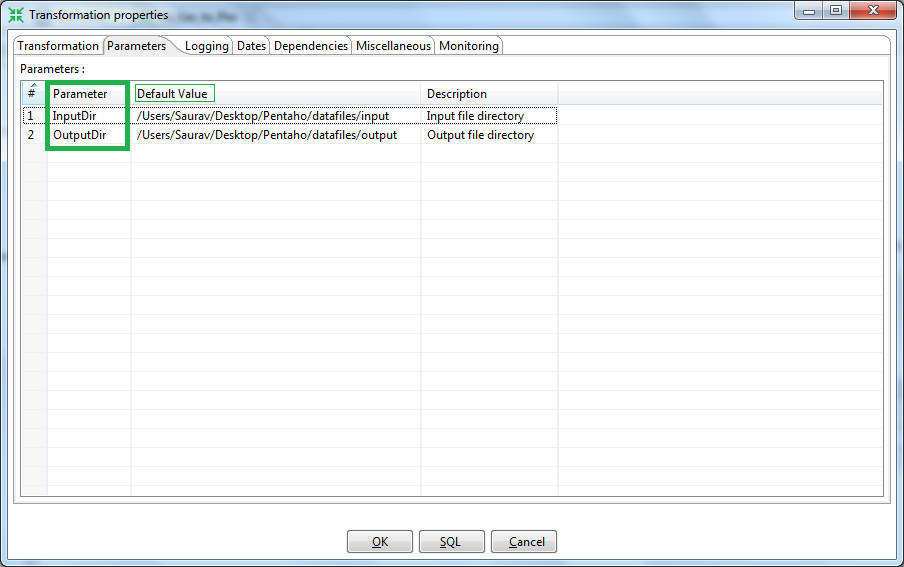
We have now successfully used the PDI Steps and our Transformation is ready to be executed. But before that let's name this first transformation of our's as Tx_Csv_to_Psv. Now let us create two parameters for the Source & Target directory along with the default path. Go to the parameters tab and define the two parameters let's say, InputDir & OutputDir as show below. Ensure to provide the correct path based on your system configuration. Next replace the paths in source & target flat files using the appropriate parameters. Parameters are accessed like ${InputDir}, ${OutputDir}
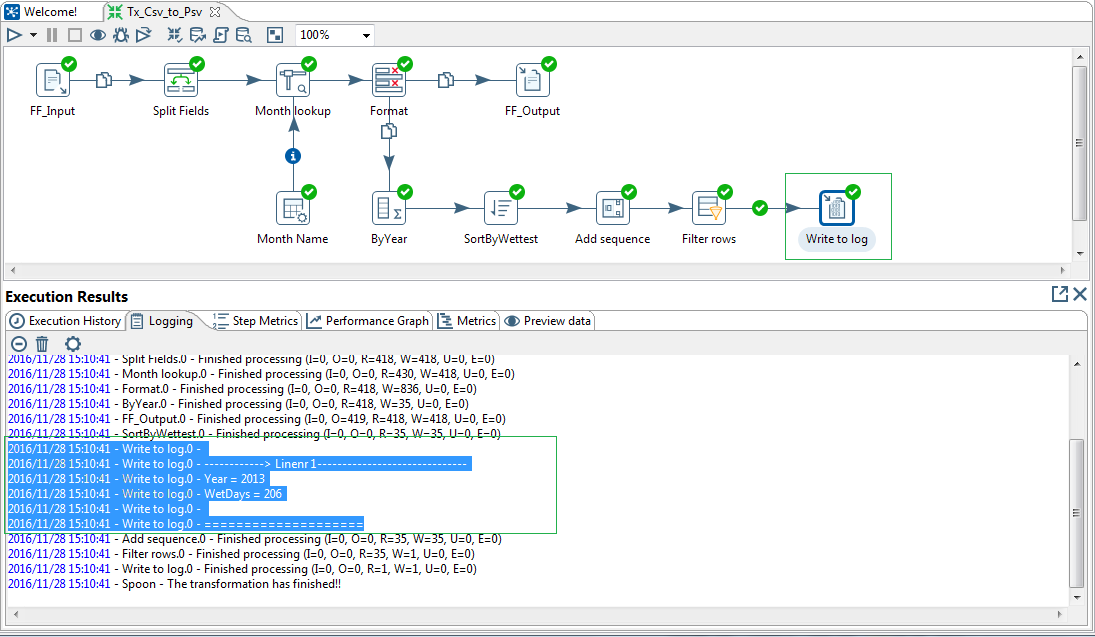
Let us run the transform and preview the data loaded in the flat file target & written in the log file under the Execution Results section of the Spoon GUI.
Our first use case is complete and now we have a better understanding of how the PDI steps works. In the next article we will look how to normalize data using PDI Row Normalizer.