Best BusinessObjects (BO) Interview Questions and Answers

This article is the continuation of Top 30 BusinessObjects (BO) Interview Questions and Answers". If you have not already read that, please start with that article first.
If you have already read that article, please continue below from the next question
14. What is a condition object? How is it different from query filter?
A condition object is a filter condition created in the universe level. When this object is dragged in the Query Panel, the filter condition appears in the query SQL.
However a query filter exists in the report only. It is added during building a query. This also appears in the query SQL.
15. How can we create a mandatory filter condition for every query generated from the universe?
For this to happen, one prerequisite is that the table which contains the object on which the filter condition is applied should be present in each and every context defined in the universe. It can be done in 2 ways:
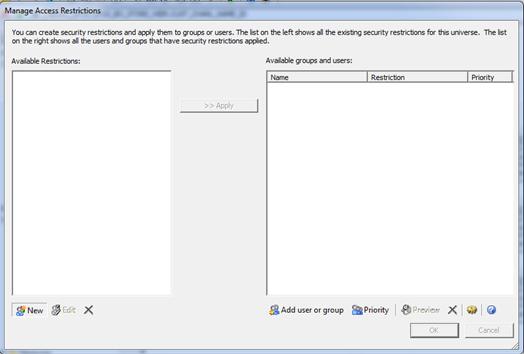
Row level Security:
From Tools -> Manage Security Click on Mange Access Restrictions. Create a new restriction. In the rows tab of the restriction select the table and add the where clause on the desired column. Apply this restriction to all user groups. The limitation of this method is that this filter condition would not be imposed unless we drag an object from the table in the query panel.
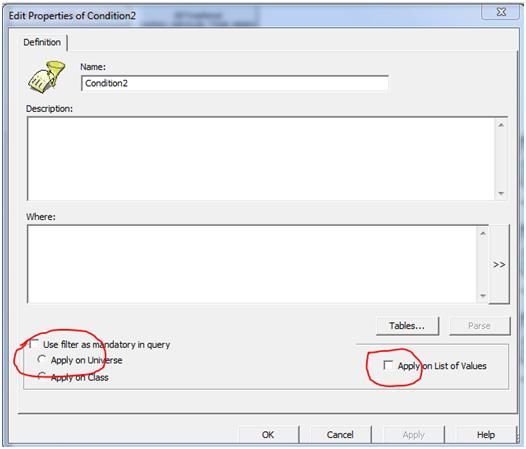
Condition Object Property:
Create a condition object with the where clause on the desired column of the desired table. In the condition object definition; check on the boxes Use Filter As Mandatory in Query and Apply On Universe and Apply On List of Values. The advantage of this method is that even if no object from the table is dragged in the Query Panel, the filter condition will still appear in the query.
16. What is a linked universe? How are they created?
Linked universe are universes which share common component such as objects, classes and joins. When two universes are linked, the source universe is called core universe while the destination is called derived universe.
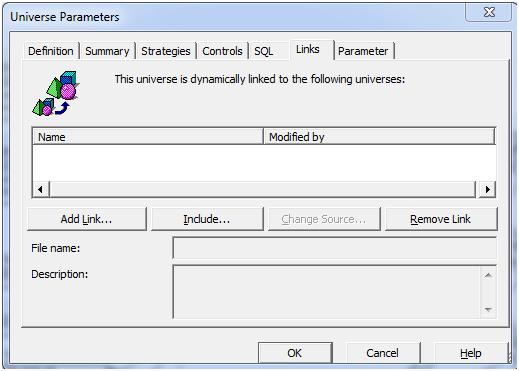
A link can be created by going to Universe Parameters -> Links and using Add Link button. The tables from core appear as faded structures in the derived universes. Their joins are intact, but the contexts need to be defined afresh.
17. What happens when we click the Include button after linking two universes?
After creating a link if the ‘Include’ button is clicked then the tables from core universe are permanently copied into the derived universe and the link is severed.
18. What is an Input control? How is it different from a report filter?
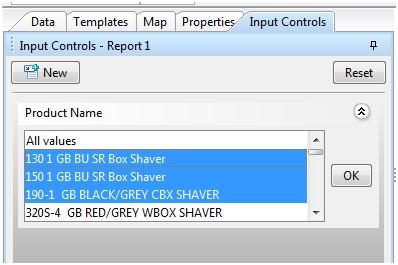
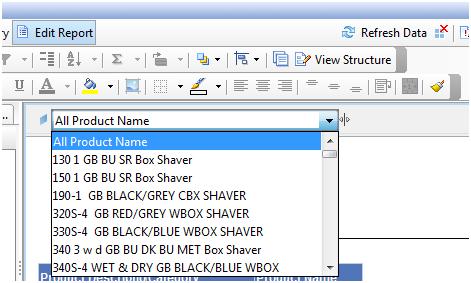
Input Control is a feature in Webi report(starting from XI 3.1 SP2), which allows filtering of data based on a dimension in the report.
The Report Filter also does a similar thing. However an input control allows multiselection of values(via Multiselect Input control) which a report filter does not support. Input Control appears in the left panel of the report, whereas Report Filter appears in the top filter pane.
19. What are the added features of Interactive mode in Web Intelligence over the normal Java report panel? What are its uses?
When Web Intelligence is in Interactive mode, one can create variables, input controls, add report filters, tables and charts in the view mode itself. This is not possible in the normal Java report panel.
The advantage of interactive mode is for power users, who want to do further manipulations on an existing report. Since, it does not allow user to modify queries or existing variables in the report, but allows doing the above mentioned activities on top of the report, it provides a very good means for analysis by the power users without changing the core report in any way.
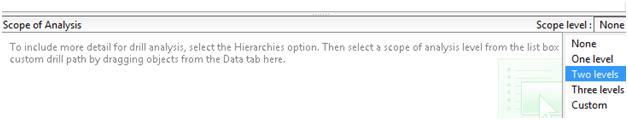
20. What is the use of the scope of analysis pane in the Query tab of Webi report?
It has 2 uses:
- The Scope of Analysis pane sets the limit of drill down in the report. Suppose we have a hierarchy defined in 3 levels, but if we set the scope of analysis is set to 2 levels, the report will not be able to drill down to the 3rd level. We can also remove objects showing in the scope of analysis pane and limit the drill down.
- If the analysis level is set to custom, the objects from existing hierarchies can be dragged in the scope of analysis panel to set the scope for drilldown in the report. This has an advantage that we can drill down to more than 3 levels, which is not possible in the normal level setting, since it is up to 3 only.
21. There is a requirement that in a numeric column of a webi report we need to display the sum of the above rows. Which function should we use?
In this case we should use the RunningSum() function. The syntax is:
RunningSum( [measure] ; [Row|Col] ; [ (reset_dimensions) ] )22. When should we use a query filter and when a report filter?
The choice of query or report filter has to take in consideration the performance of the report.
Suppose we have report where are multiple tabs having different objects requiring same or different filter conditions, it is advisable to use a Query Filter.
In case where there are multiple tabs having same objects, but with slightly differing filter conditions, it is advisable to fetch the whole data in the query and then apply report filters to the various tabs to get the desired data instead of using separate queries for each tab.
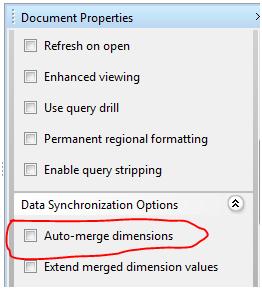
23. What is the use of merge Dimensions functionality? How does auto-merge work?
The merge dimensions is used to combine objects having similar properties from multiple data providers which enables using dimensions and measures from both data providers in the same table. It works like a full outer join. Without this we cannot drag dimensions from different data providers in the same table and though the measures can be dragged, their calculation levels may not be uniform.
When the Auto Merge Dimensions checkbox in the document properties is checked, the report automatically merges multiple dimensions with same name coming from different data providers.
24. What is the difference between Input and Output calculation contexts in a Webi report?
Input context consists of any dimension objects that need to be included directly in the calculation itself.
Output context consists of one or more dimension objects that determine the aggregation level at which the calculation is displayed
25. In oracle, we use Instr function to display the position of a character in a string. What is the corresponding BO Web Intelligence report function, that does the same?
The corresponding function is Pos(). The syntax is:
Pos( string input_string; string pattern )26. Suppose in a report, we have a filter on a block. In the table, we need to display an aggregate of a measure for all data in report. But if we use only the aggregate function, it will be limited by the block filter. How can we achieve that?
We have to use the NoFilter() function. When we put the expression within NoFilter(), it overrides any report filter as well as ranking applied in report level. The syntax is :
NoFilter( expression )27. Suppose we want to display the total sum of a measure in row level of the report block. What will be the solution?
We have to use context Operator In along with keyword report. This will give the total sum of the measure in row level(and anywhere in the report). The expression will be like:
Sum( Measure In Report )28. Which selector gives the option of multiple selection in Xcelcius Dashboard? How do we make the multiple selection?
Only ‘List Builder’ gives the option of multiple selection in Xcelcius. We select multiple rows from the input list and add them to the output list using Add button. The output list gives the selection parameter.
29. Which Xcelcius components can we use for linking multiple dashboard flash outputs(swf files)? Can the same components be used for a complete presentation?
We can use ‘Swf Loader’ as well as ‘Slideshow’ components for linking multiple dashboards. ‘Swf Loader’ can open swf files only, while ‘Slideshow’ can open both swf files and image files.
For presentation purposes, we often need text and images. Hence these are embedded in image files are added to a ‘Slideshow’ along with dashboard outputs. Moreover ‘Swf Loader’ can only open swf through ‘Push Button’ or selector components, whereas ‘Slideshow’ has a feature of automatic slide transition, which loads the image and swf files in the specified sequence. Hence, ‘Slideshow’ is the only feasible option for a complete presentation.
30. What are the different ways in which an Xcelcius dashboard can access data from a BO universe?
There are 3 ways in which Xcelcius can access data from the universe:
- Query as a Web Service: Using Query as a Web Service tool, we can create a queries from the universe along with filter condition. The QAAWS query panel is similar to the WebIntelligence query panel. In Xcelcius dashboard, we can create a QAAWS connection that would point to a particular Query and import the data into the excel data sheet of the xlf.
- Business Intelligence Web Service: In this method, we can use the output of a report directly in the Xcelcius dashboard. Using Webi Rich Client, we export the report to repository, then select a block from the report, right click and select Publish as Web Service option. However BIWS does not have a connection of its own. We access this BIWS through a QAAWS connection only.
- LiveOffice: LiveOffice is an additional component that needs to be installed. This creates a sort of plugin for all MS Office applications, though which they can access data from Web Intelligence reports. I MS Excel, we can launch the Live Office Insert Wizard by Insert -> Web Intelligence Content. We can use this wizard to add selective content from a webi report. In the Xcelcius dashboard, a Live Office connection is created and we access this Live Office excel sheet though this connection.