Using Pentaho Row Denormaliser step

In this article we will learn how to use Pentaho Data Integration Row Denormaliser Step. Denormaliser step is used to denormalize or pivot data from normalized dataset or table. The Denormaliser step combines data from several rows into one row by creating new Target columns/fields. For each unique values for the Key field and each selected Group field, this step produces a target column in the output data set. It basically creates one row of data from several existing rows, i.e. to Pivot Rows to Columns.
Based on our previous use case, let's take the Budget table as source and try to generate Pivot table data in Excel file. For that we have to use the Denormaliser step to pivot the normalized dataset.
Below is how our source sales budget data in Oracle database looks like:
| STORE | YEAR | QUARTER | BUDGET |
| Clementi | 2016 | Q1 | 50000 |
| Clementi | 2016 | Q2 | 70000 |
| Clementi | 2016 | Q3 | 65000 |
| Clementi | 2016 | Q4 | 85000 |
| River Valley | 2016 | Q1 | 30000 |
| River Valley | 2016 | Q2 | 29000 |
| River Valley | 2016 | Q3 | 33000 |
| River Valley | 2016 | Q4 | 31000 |
| Clementi | 2017 | Q1 | 55000 |
| Clementi | 2017 | Q2 | 75000 |
| Clementi | 2017 | Q3 | 70000 |
| Clementi | 2017 | Q4 | 88000 |
This is how our expected target data in Excel as yearly & quarterly sales budget should look like:
| STORE | YEAR | QUARTER1 | QUARTER2 | QUARTER3 | QUARTER4 |
| Clementi | 2016 | 50000 | 70000 | 65000 | 85000 |
| River Valley | 2016 | 30000 | 29000 | 33000 | 31000 |
| Clementi | 2017 | 55000 | 75000 | 70000 | 88000 |
Below are the steps we will be covering in this use case scenario.
- Read Oracle database table, using Table input
- Sort data based on Group fields, using Sort rows
- Denormalize or pivot data, using Row Denormaliser
- Sort data before writing to excel, using Sort rows
- Write pivot data to excel data file, using Microsoft Excel Writer
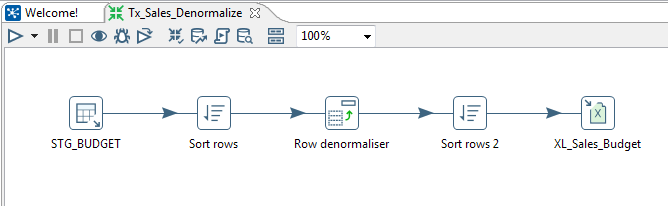
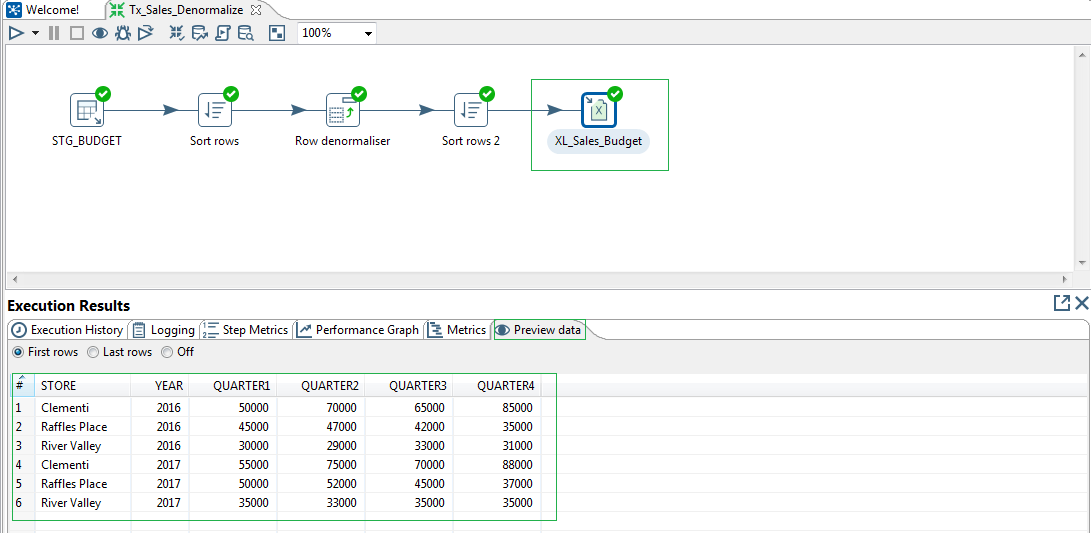
Find below the use case transformation:
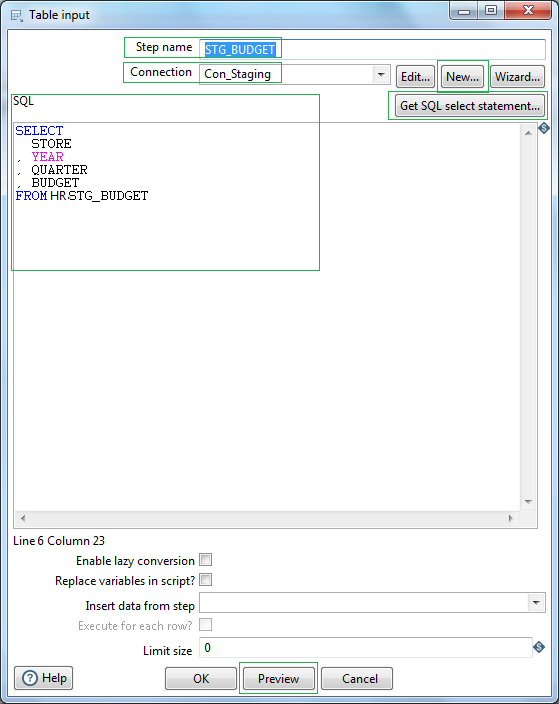
First in order to read database table from relational database, in our case Oracle RDBMS we will be using Table input. Let's name the step as STG_BUDGET. At first we need to create the connection object. Click New or Wizard and create a connection.
Let's name the connection as Con_Staging. Select Connection type as Oracle & Driver as Native (JDBC). The Oracle jdbc driver might not be available to PDI. In that case you have to download oracle jdbc driver ojdbc6.jar and place in the PDI lib directory, i.e. data-integration/lib/ . Next define the hostname, database name, port, username and password to connect to your oracle instance. Test to check the connection and click OK.
Next click the button Get SQL select statement. Browse Schema & select the table. Once selected, click Yes for Do you want to include the field names in SQL.. That's all. So the source RDBMS table is ready for reading. Preview your records to confirm that PDI is able to read the source database table content as expected.
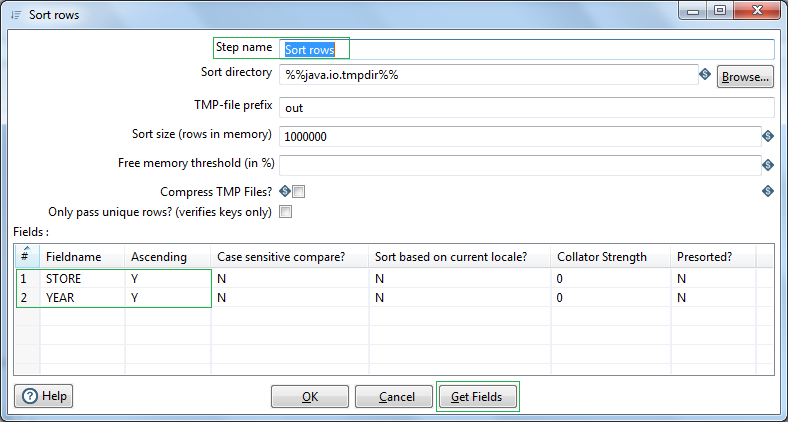
Next before we can use the Denormaliser step, we need to Sort the data based on the Group columns/keys in our case STORE & YEAR.
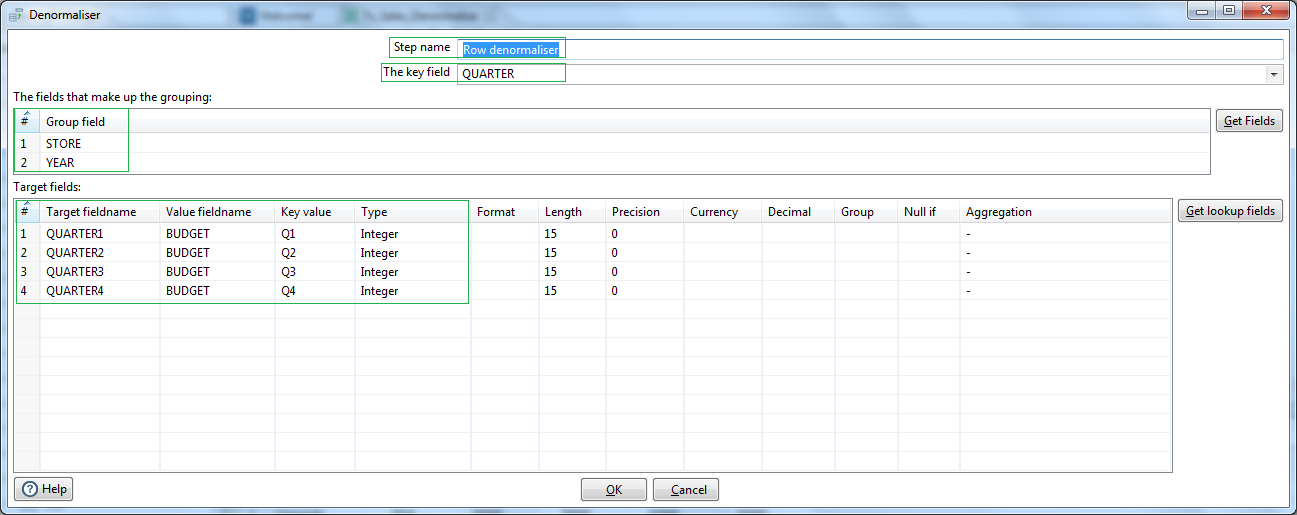
Next we are using a Row Denormaliser step. Select the Key field as the QUARTER. This is the source field which will be denormalized based on the values, i.e. Key value. Next in the Group field section map the Source fields STORE & YEAR. In the Target fields section lets put the Target fieldname corresponding to Key Values Q1, Q2, Q3, Q4 as QUARTER1, QUARTER2, QUARTER3, QUARTER4 respectively. For all these these target fields the source Value fieldname is BUDGET, which has the amount figures corresponding to the quarter key values.
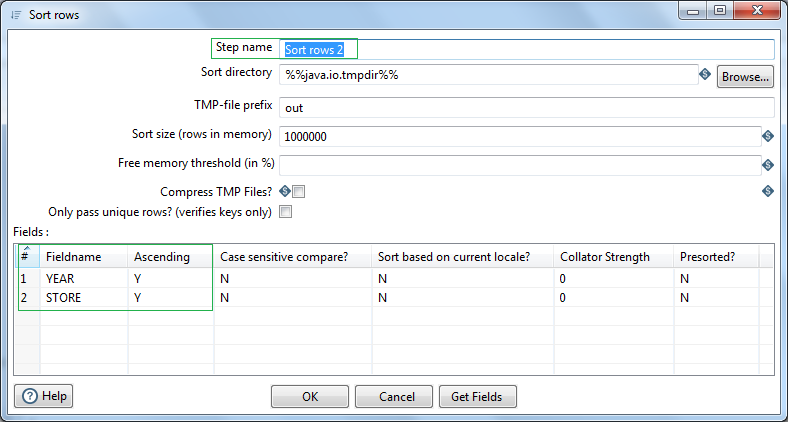
Before we write the Pivot data to excel we want to sort the order of the data year wise. So for that we will again use another Sort rows step. Sort the denormalized data based on YEAR followed by STORE.
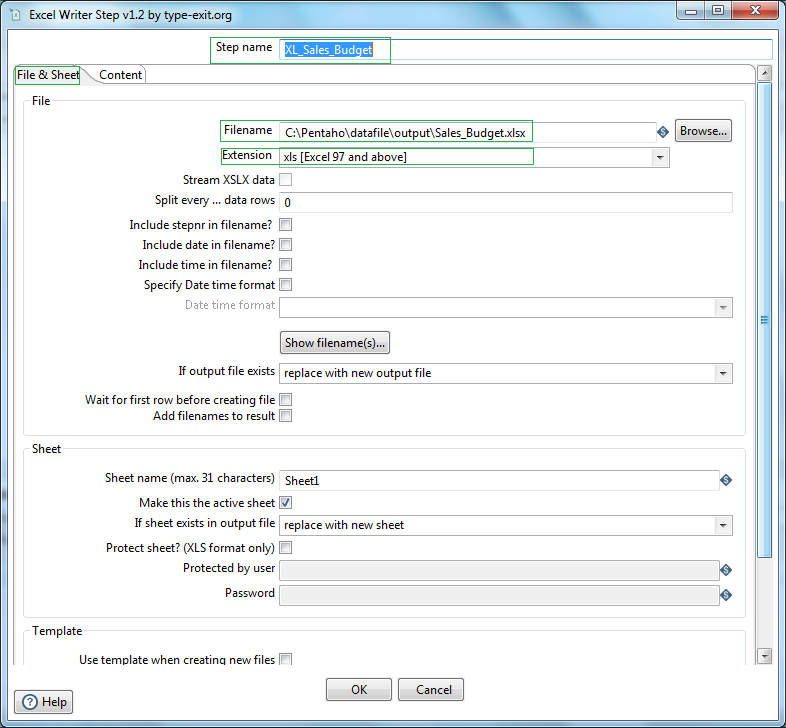
Next in order to write the data in Excel (xslx format) we will be using Excel writer step. Let's name this as XL_Sales_Budget. Browse and select the location where we want to write the file. Select extension as Excel 97 and above. go to the Sheets tab and click on Get sheetnames. Select the correct data sheet. In my case it is Sheet1. In the contents tab check the Header option, as we have a header record in our excel sheet.
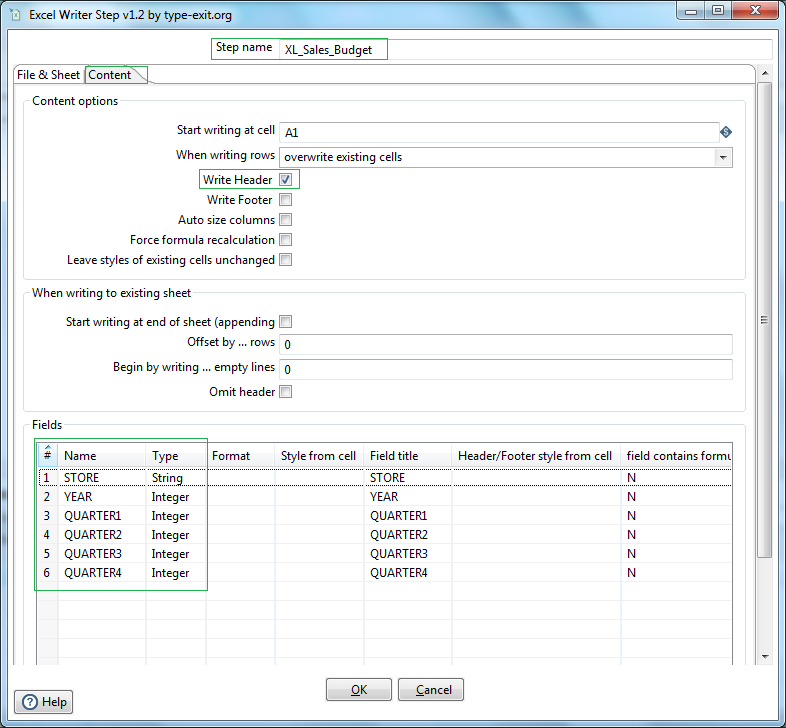
Next go to the contents tab, select Write header. Next click the button Get fields. Check and modify the Fields name & data type.
All done! Let us run the Transformation from Spoon and validate the output data in the excel from the Preview tab of the Execution Results section.
So we have successfully completed rdbms read, denormalize data and excel write.